. 2013 Feb 27;33(9):4151-64.
doi: 10.1523/JNEUROSCI.2721-12.2013.

Tyrosine phosphorylation regulates the endocytosis and surface expression of GluN3A-containing NMDA receptors

Affiliations

Tyrosine phosphorylation regulates the endocytosis and surface expression of GluN3A-containing NMDA receptors

Dhrubajyoti Chowdhury et al. J Neurosci. .

Abstract

Selective control of receptor trafficking provides a mechanism for remodeling the receptor composition of excitatory synapses, and thus supports synaptic transmission, plasticity, and development. GluN3A (formerly NR3A) is a nonconventional member of the NMDA receptor (NMDAR) subunit family, which endows NMDAR channels with low calcium permeability and reduced magnesium sensitivity compared with NMDARs comprising only GluN1 and GluN2 subunits. Because of these special properties, GluN3A subunits act as a molecular brake to limit the plasticity and maturation of excitatory synapses, pointing toward GluN3A removal as a critical step in the development of neuronal circuitry. However, the molecular signals mediating GluN3A endocytic removal remain unclear. Here we define a novel endocytic motif (YWL), which is located within the cytoplasmic C-terminal tail of GluN3A and mediates its binding to the clathrin adaptor AP2. Alanine mutations within the GluN3A endocytic motif inhibited clathrin-dependent internalization and led to accumulation of GluN3A-containing NMDARs at the cell surface, whereas mimicking phosphorylation of the tyrosine residue promoted internalization and reduced cell-surface expression as shown by immunocytochemical and electrophysiological approaches in recombinant systems and rat neurons in primary culture. We further demonstrate that the tyrosine residue is phosphorylated by Src family kinases, and that Src-activation limits surface GluN3A expression in neurons. Together, our results identify a new molecular signal for GluN3A internalization that couples the functional surface expression of GluN3A-containing receptors to the phosphorylation state of GluN3A subunits, and provides a molecular framework for the regulation of NMDAR subunit composition with implications for synaptic plasticity and neurodevelopment.


Figures

Figure 1.
Figure 1.
The GluN3A C terminus contains an autonomous endocytic signal. A, Either full-length GluN3A carrying an extracellular GFP-tag along with GluN1 and GluN2A, or the GluN3A C terminus alone fused to the interleukin-2α receptor (Tac), was transfected into HEK293 or COS7 cells, respectively. Cells were incubated live with anti-GFP or anti-Tac antibody at 4°C, washed, and returned to 37°C for 30 min to allow endocytosis. After fixation and permeabilization, internalized receptors (Int; red) were visualized with Cy3-conjugated secondary antibodies. Representative images are shown; the green fluorescence arises either from total GFPGluN3A (left) or labeling of surface-expressed Tac constructs with FITC-conjugated secondary antibody before permeabilization (middle, right). Green and red channels were overlaid in all images. B, Schematic representation of TacGluN3A and serial truncations of the C-terminal tail used. The C-terminal tail follows the fourth membrane domain (M4); numbers refer to the amino acid residue at which truncations were made to generate the chimeric Tac receptors. C, GluN3A C-terminal residues 952–977 are sufficient to drive Tac endocytosis, but deleting the 966–977 stretch largely diminished internalization. Representative images are shown. Note the marked surface accumulation displayed by the internalization-defective TacGluN3A966Δ truncation. D, Quantification of the percentage of cells showing internalization (n = 180–360 cells analyzed from 3 to 5 independent experiments, ***p < 0.001 vs TacGluN3A, ANOVA followed by Tukey's test). Internalization was scored in cases where Tac surface staining was lost with a parallel appearance of intracellular puncta. In this and all subsequent figures, data represent mean ± SEM. E, Surface expression of the different Tac-chimeras normalized to total expression and expressed as percentage of TacGluN3A. Note that the levels of surface expression reflected the degree of internalization for each truncation (n = 3–4 independent experiments, ***p < 0.001 vs TacGluN3A, ANOVA followed by Tukey's test). F, A TacGluN3A construct lacking the membrane-proximal domain of GluN3A C terminus (952–976) was defective in internalization (n = 60–100 cells from 3 independent experiments, ***p < 0.001 vs TacGluN3A, ANOVA followed by Tukey's test). Scale bars, 20 μm.
Figure 2.
Figure 2.
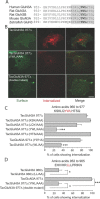
A YWL motif proximal to the fourth transmembrane domain is critical for TacGluN3A endocytosis. A, The membrane-proximal region of the GluN3A C terminus spanning the 966–977 aa stretch required for internalization (shaded) contains a tyrosine-based signal (in bold), which is highly conserved across species. B, C, Alanine substitutions of residues within this endocytic domain demonstrate a critical role of the YWL motif in GluN3A endocytosis. B, D, Residual internalization of TacGluN3A977Δ (YWL/AAA) was abolished by additional mutation of a dileucine sequence upstream of the YWL motif. Internalization assays and quantification were performed as in Figure 1; red intracellular puncta represent internalized proteins while surface immunostaining is shown in green (n = 180–300 cells analyzed from 3 to 5 independent experiments; ***p < 0.001 relative to TacGluN3A977Δ, *p < 0.05 relative to the indicated control group; ANOVA followed by Tukey's test). Scale bar, 20 μm.
Figure 3.
Figure 3.
Mutation of the YWL endocytic motif alters the surface expression of GluN3A-containing NMDARs. A–D, HEK293 cells were transfected with wild-type or endocytosis-deficient GFPGluN3A along with GluN1-1a and GluN2A and subjected to whole-cell recordings. A, Left, Representative traces in response to 1 s pulse of glutamate (1 mm) and glycine (100 μm). Right, Summary graph comparing current densities of cells expressing wild-type GluN3A and YWL/AAA mutant. Current density was calculated as the peak amplitude of initial currents (pA) normalized by membrane capacitance (pF). B, Representative steady-state I–V relationships in 2 mm Ca2+ (red) or 10 mm Ca2+ (black) for the indicated subunit combinations are shown. Insets, Expanded views of the region of the I–V curves near Erev. C, Summary graph of the shift in reversal potential (ΔErev) determined from the steady-state I–V relations for GluN1/2A and GluN1/2A/3A (wild-type vs YWL/AAA mutant). D, Summary graph of the extent of desensitization for recombinant NMDARs calculated as the steady-state/peak current elicited in response to agonist application. Representative traces appear above the corresponding column (n = 13–16 cells per condition, *p < 0.05, **p < 0.01, Student′s t test). E, Cultured hippocampal neurons expressing GFPGluN3A or GFPGluN3A (YWL/AAA) were incubated live with anti-GFP antibody to label surface receptors (red). Green fluorescence was used to estimate total GFPGluN3A expression. Scale bar, 20 μm. F, Higher magnification images of total and surface GFPGluN3A expression in dendritic compartments of transfected neurons. Scale bar, 5 μm. G, Quantification of GluN3A surface expression normalized to total GFPGluN3A fluorescence intensities. Note that mutation of the YWL motif increased surface GluN3A levels, and that this effect was mimicked and occluded by chronic activity blockade for 72 h with TTX (n = 37–41 neurons analyzed from 3 to 4 independent experiments, *p < 0.05, Student's t test). H, Summary graph of the ratio of NMDA-evoked currents obtained at −60 mV to +40 mV in the presence of 100 μm Mg2+ for hippocampal neurons transfected with either GFPGluN3A (n = 10) or GFPGluN3A (YWL/AAA) (n = 8), *p < 0.05, Student's t test. Representative traces at −60 mV (black traces) and +40 mV (red traces) for each condition normalized to their respective currents at +40 mV.
Figure 4.
Figure 4.
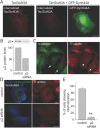
GluN3A is internalized via clathrin-dependent endocytosis. A, TacGluN3A internalization is dynamin dependent. Internalization assays were performed on COS7 cells transfected with TacGluN3A with or without a dynamin1 dominant-negative mutant (GFP-DynK44A) (green). Internalized proteins appear as intracellular puncta (red). B, Whole-cell extracts prepared from HeLa cells transfected with or without siRNAs against μ2 were analyzed by immunoblotting. Knockdown of μ2-AP2 resulted in a 50% reduction in endogenous μ2 protein levels. C, As well as affecting its target, μ2 knockdown caused a depletion of α-adaptin, another component of the AP2 complex, and impaired the uptake of fluorescent Tf (white arrows). siRNA-transfected cells were stained with an antibody against α-adaptin (green) following Tf uptake (red). D, TacGluN3A internalization was blocked in AP2-depleted cells. Note the lack of intracellular puncta (green) in cells transfected with μ2 siRNAs identified by deficient Tf uptake (right). Surface TacGluN3A immunostaining is in blue. E, Quantification of the percentage of cells showing internalization in the assays from D (n = 60–66 cells from 2 independent experiments, **p < 0.01, Student′s t test). Scale bars, 20 μm.
Figure 5.
Figure 5.
GluN3A interacts with the μ2 subunit of AP2 adaptor complex. A, The GluN3A C terminus (GluN3A-Ct) specifically binds the μ2 subunit of AP2. The YWL/AAA mutant largely reduced the interaction whereas neither a single point mutation of the tyrosine within YWL (Y971F) nor mutation of the LL residues (LL/AA) altered binding. GST, GST fused to wild-type GluN3A-Ct (GST-GluN3A-Ct) or endocytosis-deficient versions were incubated with forebrain lysates and the bound material was analyzed by immunoblotting for the indicated proteins; input, 1% of forebrain lysate used for incubation. B, Direct binding of the GluN3A-Ct to recombinant μ2. Wild-type or mutant GST-GluN3A-Ct was incubated with purified His-tagged μ2 (amino acids 158–435), and bound material was analyzed by SDS-PAGE followed by Coomassie blue staining. The arrowheads denote the GST fusion proteins and bound μ2. Input, 20% of the total amount of recombinant μ2 added to the assay. Molecular weights (in kD) are indicated. C, Recombinant μ2 (amino acids 158–435) fused to GST (GST-μ2) was incubated with extracts from HEK293 cells transfected with GFPGluN3A or GFPGluN3A977Δ with or without alanine mutations of the YWL motif. Bound material was analyzed by immunoblotting with anti-GFP antibody, and GST fusion proteins visualized with Ponceau S. The graph shows the quantification of the amount of GFPGluN3A bound to GST-μ2; Ponceau-stained bands were used for normalization (n = 4, *p < 0.05, Student′s t test). D, Association of endogenous GluN3A and AP2 in mouse forebrain. Solubilized forebrain membrane extracts were incubated with antibody against α-adaptin (AP2) or rabbit (Rb) IgG and immunoprecipitates (IP) immunoblotted with the indicated antibodies. Input, 10% of brain extract used for IP.
Figure 6.
Figure 6.
GluN3A is phosphorylated by the tyrosine kinase Src. A, HEK293 cells expressing GFPGluN3A were treated with different concentrations of pervanadate for 15 min, and whole-cell lysates incubated with anti-GFP antibody. The immunoprecipitates were analyzed by immunoblotting with anti-phosphotyrosine (pY) antibody, and reprobed for GluN3A. Precise overlap between the phosphotyrosine and GluN3A signals confirmed that the phosphorylation signal (*) belonged to GluN3A. B, HEK293 cells were cotransfected with GFPGluN3A and a constitutively active form of Src (Src-YF) or its kinase-dead version (Src-KD) and GluN3A phosphorylation analyzed as in A. A phosphotyrosine signal corresponding to immunoprecipitated GluN3A (*) was detected only in the presence of Src-YF. Inputs show relative levels of cellular tyrosine-phosphorylated proteins per condition. C, Solubilized mouse forebrain membranes were immunoprecipitated with anti-pY antibody and immunoblotted for GluN3A. Input, 10% of lysate used for IP. D, Wild-type GST-GluN3A-Ct (WT), or mutant versions with Y971 alone (Y971F) or all tyrosines replaced by phenylalanines (3Y–3F), were phosphorylated in vitro with recombinant Src in the presence of [γ-32P]ATP. Reaction mixtures were separated in SDS-PAGE followed by Coomassie blue staining and autoradiography. Top, Representative autoradiograph. Bottom, Coomassie blue-stained GST fusion proteins in the same gel. Substitution of Y971 (Y971F) decreased the radioactive signal while simultaneous substitution of all the tyrosine residues (3Y–3F) abolished it. Autophosphorylation of Src is indicated. Φ, No fusion protein was included. Molecular weights (in kD) are indicated. Graph depicts quantification of the incorporation of radioactive label into GST fusion proteins normalized to values of Coomassie-stained bands (n = 4 independent experiments, **p < 0.01, Student′s t test).
Figure 7.
Figure 7.
Increased phosphorylation reduces surface GluN3A expression by modulating AP2 binding. A, HEK293 cells expressing wild-type GluN3A or phospho-defective Y971F mutant along with GluN1-1a were treated with pervanadate (150 μm) for 15 min. Surface proteins were biotinylated and isolated with NeutrAvidin-agarose beads, and total and surface fractions analyzed by immunoblotting with anti-GluN3A antibody. The absence of the intracellular protein tubulin from the surface fraction confirmed that only surface proteins were recovered. The graph shows quantification of surface GluN3A (n = 3 independent experiments, **p < 0.01, Student′s t test). B, Pull-down assays using GST-μ2 and extracts from HEK293 cells expressing GFPGluN3A or GFPGluN3A-Y971F mutant. Bound material was analyzed by immunoblotting with anti-GFP antibody. Graph shows quantification; Ponceau-stained bands of GST-μ2 from same blot were used for normalization (n = 4 independent assays, *p < 0.05, Student′s t test). C, Association of GluN3A with AP2 was monitored in cortical neuronal cultures treated with pervanadate (200 μm, 15 min). Cell lysates were incubated with anti-GluN3A antibody, and immunoprecipitates were immunoblotted with α-adaptin and GluN3A antibodies. Input, 10% of lysate. D, Surface biotinylation assay in HEK293 cells expressing wild-type GluN3A or the phosphomimetic Y971E mutant along with GluN1-1a. Surface and total fractions were analyzed as above. Graph shows quantification of surface GluN3A (n = 3, **p < 0.01, Student′s t test). E, Pull-down assays using mouse brain lysates and GST, wild-type GST-GluN3A-Ct, or GST-GluN3A-Ct-Y971E mutant. Bound material was analyzed by immunoblotting with antibodies against α- and μ2-adaptins. Ponceau-stained bands of GST fusion proteins (arrowheads) were used for normalization of the immunoreactivity within each lane. Graph shows quantification of the amount of α-adaptin pulled down by GST-GluN3A fusion proteins (n = 3, *p < 0.05, Student′s t test). F, G, Whole-cell recordings from HEK293 cells expressing either wild-type GluN3A or GluN3A-Y971E along with GluN1-1a and GluN2A. F, Summary graph of the shift in reversal potential (ΔErev) of NMDAR currents measured in low and high extracellular Ca2+ (n = 10 cells per condition, *p < 0.05, Student's t test). G, Summary graph of the extent of NMDAR current desensitization. Normalized representative traces in response to agonist application appear above the corresponding column (n = 10–16 cells, **p < 0.01, Student's t test).
Figure 8.
Figure 8.
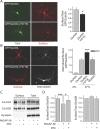
Phosphorylation regulates the endocytosis and surface expression of GluN3A in neurons. A, Cultured hippocampal neurons transfected with GFPGluN3A or GFPGluN3A-Y971E were incubated live with anti-GFP antibody to label surface receptors (red). Green fluorescence was used to estimate total GFPGluN3A expression. Data represent means of GluN3A surface expression normalized to total GFPGluN3A fluorescence. (n = 46–52 neurons from 4 independent experiments per condition, *p < 0.05, Student's t test). B, Internalization was measured using fluorescence-based antibody uptake assays in neurons maintained in normal culture medium at 4°C (no endocytosis control) or 37°C (basal endocytosis), or in culture medium plus PP2 (10 μm for 15 min after a 30 min pre-incubation). Representative images of surface (red) and internalized (white) GFPGluN3A and GFPGluN3A-Y971E are shown. Data represent means of GluN3A endocytosis normalized to its surface expression (n = 39–40 neurons from 4 independent experiments, ***p < 0.001 relative to wild-type, Student′s t test). Scale bar, 40 μm. C, Cortical cultures (DIV 10) were treated with PACAP-38 (1 nm) for 1 h after 1 h pre-incubation with or without PP2 (10 μm). Surface proteins were biotinylated, and surface and total fractions analyzed by immunoblotting and probed for the indicated proteins. Absence of the intracellular protein synapsin from surface fractions confirmed the specificity of the assay. D, Graphs show quantification of relative surface levels of endogenous GluN3A and GluN2B (n = 3–7 independent experiments, ***p < 0.001, *p < 0.05, Student′s t test).

Similar articles

Cited by

References

    1. Ahmadian G, Ju W, Liu L, Wyszynski M, Lee SH, Dunah AW, Taghibiglou C, Wang Y, Lu J, Wong TP, Sheng M, Wang YT. Tyrosine phosphorylation of GluR2 is required for insulin-stimulated AMPA receptor endocytosis and LTD. EMBO J. 2004;23:1040–1050. - PMC - PubMed
    1. Barria A, Malinow R. Subunit-specific NMDA receptor trafficking to synapses. Neuron. 2002;35:345–353. - PubMed
    1. Bonifacino JS, Traub LM. Signals for sorting of transmembrane proteins to endosomes and lysosomes. Annu Rev Biochem. 2003;72:395–447. - PubMed
    1. Burzomato V, Frugier G, Pérez-Otaño I, Kittler JT, Attwell D. The receptor subunits generating NMDA receptor mediated currents in oligodendrocytes. J Physiol. 2010;588:3403–3414. - PMC - PubMed
    1. Chen BS, Roche KW. Regulation of NMDA receptors by phosphorylation. Neuropharmacology. 2007;53:362–368. - PMC - PubMed

Publication types

MeSH terms

LinkOut - more resources