. 2013 Feb 27;33(9):4181-91.
doi: 10.1523/JNEUROSCI.4423-12.2013.

Layer-specific experience-dependent rewiring of thalamocortical circuits

Affiliations

Layer-specific experience-dependent rewiring of thalamocortical circuits

Lang Wang et al. J Neurosci. .

Abstract

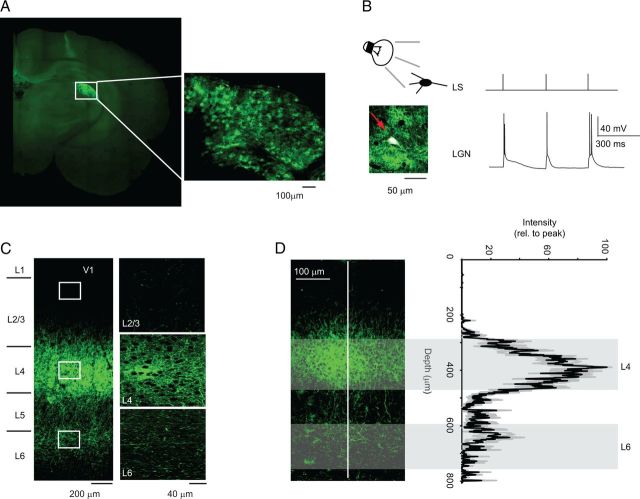
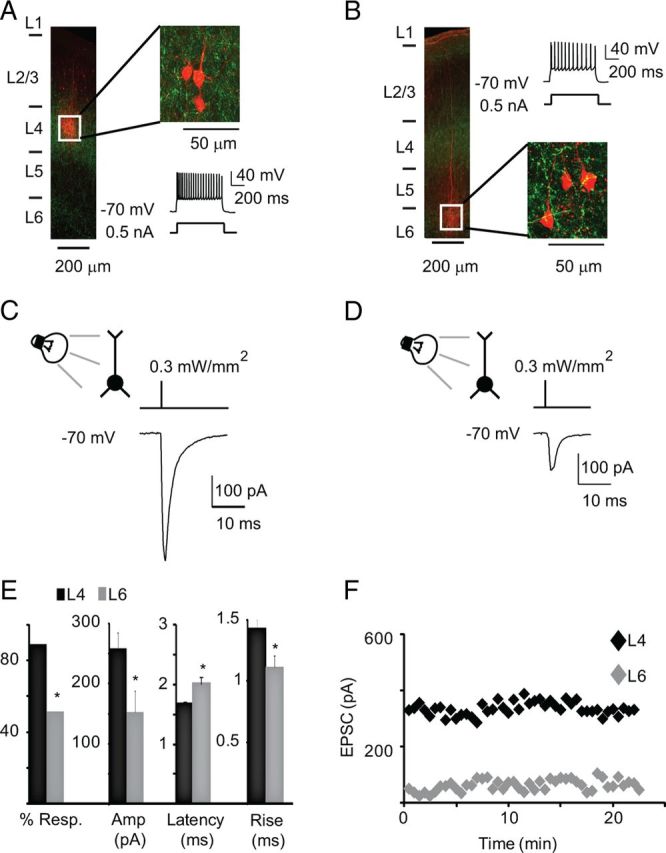
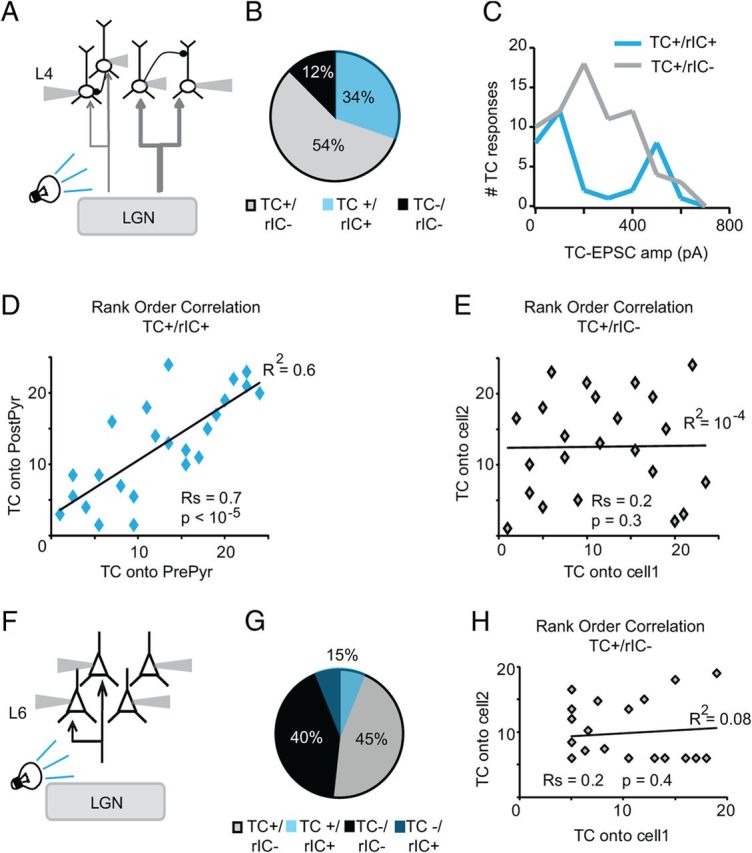
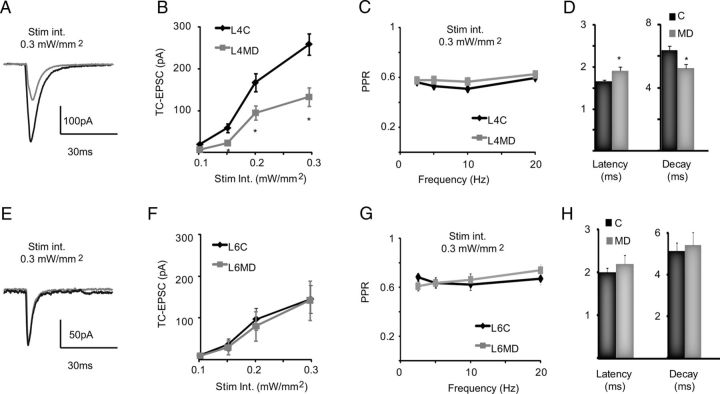
Thalamocortical circuits are central to sensory and cognitive processing. Recent work suggests that the thalamocortical inputs onto L4 and L6, the main input layers of neocortex, are activated differently by visual stimulation. Whether these differences depend on layer-specific organization of thalamocortical circuits; or on specific properties of synapses onto receiving neurons is unknown. Here we combined optogenetic stimulation of afferents from the visual thalamus and paired recording electrophysiology in L4 and L6 of rat primary visual cortex to determine the organization and plasticity of thalamocortical synapses. We show that thalamocortical inputs onto L4 and L6 differ in synaptic dynamics and sensitivity to visual drive. We also demonstrate that the two layers differ in the organization of thalamocortical and recurrent intracortical connectivity. In L4, a significantly larger proportion of excitatory neurons responded to light activation of thalamocortical terminal fields than in L6. The local microcircuit in L4 showed a higher degree of recurrent connectivity between excitatory neurons than the microcircuit in L6. In addition, L4 recurrently connected neurons were driven by thalamocortical inputs of similar magnitude indicating the presence of local subnetworks that may be activated by the same axonal projection. Finally, brief manipulation of visual drive reduced the amplitude of light-evoked thalamocortical synaptic currents selectively onto L4. These data are the first direct indication that thalamocortical circuits onto L4 and L6 support different aspects of cortical function through layer-specific synaptic organization and plasticity.


Figures

Figure 1.
Figure 1.
Optogenetic approach to the study of TC synapses from the LGN onto V1. A, Example of injection of ChR2-GFP in the LGN. The injection was performed on P14 rats and the image was obtained at P28. Top right, Expanded image of the injection site. B, Diagram of experimental configuration and image of LGN recorded neuron (white cell stained with biocytin/Alexa647, see arrow). LS, Light stimulation was delivered using 3 pulses of 1 ms. LGN, Sample trace of LGN neuron activity in response to light stimulation. Note that light stimulation effectively activates LGN neurons above threshold. C, Image of LGN terminal fields in acute coronal slices containing V1. The white squares indicate regions of interest that were expanded in the images on the right. D, ChR2 expression in LGN axonal fields is reliable across slices and preparations. Left, Sample image of a coronal slice used for patch-clamp recordings. Right, Average (black) and SD (gray) of profile of the intensity of the fluorescence signal measured in the region of interest (ROI) indicated by the white line in the left image. Width of ROI: 20 μm. The average plot results from the average of measurements across all recorded slices in which neurons fit our criteria for inclusion in the data analysis. The depth axis is aligned in the plot and in the image. The shaded areas indicate the depth at which recordings in L4 and L6 were performed. Note that the low variability of the level of expression of our construct across preparations.
Figure 2.
Figure 2.
Pyramidal neurons in L4 and upper L6 respond to light activation of TC afferents. A, Post hoc reconstruction of recording configuration in L4. Left, Image of a coronal slice in which a triplet of star pyramidal neurons was recorded in L4. White square, Region in which neurons were recorded. Green, ChR2-GFP; red, biocytin-Alexa Fluor 594. Top right, Enlargement of the region indicated by the white square. Bottom right, Firing pattern of recorded neurons in response to a 0.5 nA current pulse. The firing pattern is typical of L4 star pyramids. B, Representative image of post hoc reconstruction of L6 recordings. Left, Image of coronal slice, with neurons recorded in L6 (see white square). Green, ChR2-GFP; red, biocytin-Alexa Fluor 594. Top right, Firing pattern of L6 neurons in response to a 0.5 nA current pulse. Firing pattern is typical of L6 pyramidal neurons. Bottom right, Enlargement of region indicated by the white square. C, Brief light pulses (1 ms/0.3 mW/mm2) evoke TC-EPSCs in L4 star pyramids. Top, Recording configuration and diagram of light stimulus. Bottom, TC-EPSC evoked from one of the neurons shown in A. D, Brief light pulses (1 ms/0.3 mW/mm2) elicit synaptic response in L6 pyramidal neurons. Top, Recording configuration and diagram of light stimulus. Bottom, Light-evoked response evoked in one of the neurons shown in B. E, Bar plot of the percentage of neurons responding to light pulses (% Resp.), of average TC-EPSC amplitude at 0.3 mW/mm2, of latency of the TC-EPSC onset from stimulus onset (Latency), and of the rise time of the light-evoked TC-EPSC (Decay) in L4 (black) and L6 (gray). F, Time course of the light-evoked responses for the neurons shown in C (L4; black) and D (L6; gray). Light intensity, 0.3 mW/mm2. Data are represented as mean ± SE; asterisks indicate significant differences.
Figure 3.
Figure 3.
Baseline properties of TC-EPSCs in L4 and L6. A, Sample traces of light-evoked TC-EPSCs in L4 and L6 neurons using different light intensities. Left, 0.2 mW/mm2; right, 0.3 mW/mm2. Black, L4; gray, L6. B, Input/output curves for TC-EPSCs in L4 (black) and L6 (gray). C, Representative traces of TC-EPSC dynamics in response to repetitive stimulation at different frequencies. Left column, TC-EPSC1 and 2 in a train of stimuli (at 3, 5 Hz, and 10 Hz) evoked by 1 ms light pulses—0.3 mW/mm2 light intensity in L4 (black) and L6 (gray). Right column, TC-EPSC1 and TC-EPSC3 of a train of stimuli (at 3, 5, and 10 Hz) in L4 (black) and L6 (gray). Dashes indicate that the trace was cut to show only the indicated TC-EPSCs. Light intensity, 0.3 mW/mm2 for L4 and L6. D, Top, Plot of average PPR versus frequency of stimulation. Bottom, Average TC-EPSC3/TC-EPSC1 ratio versus the frequency of stimulation. For both plots, light intensity: 0.3 mW/mm2; black, L4; gray, L6. Data are presented as mean ± SE, asterisks indicate significant differences.
Figure 4.
Figure 4.
Layer-specific organization of TC circuits. A, Diagram of recording configuration. Light pulses activate LGN terminal fields in V1. Simultaneous patch-clamp recordings are obtained from visually identified star pyramids in L4. Stimulation and recordings are within an area of interest of 100 μm × 100 μm. Light intensity was set at 0.3 mW/mm2. B, Pie chart indicating proportion of star pyramids not responsive to light stimulation of TC afferents and not recurrently connected in L4 (black, TC−/rIC−); of neurons responding to light stimulation of TC afferents, but not recurrently connected (gray, TC+/rIC−); and of neurons responding to light stimulation of TC afferents and also recurrently connected (blue, TC+/rIC+). C, Distribution of the amplitude of light-evoked TC responses for the population of neurons that are not recurrently connected (gray) and for the population of neurons that are recurrently connected within L4 (blue). Note the bimodal distribution of the population of TC+/rIC+ neurons. D, Rank-order correlation of the TC-EPSC onto the presynaptic neurons versus that onto the postsynaptic neuron on TC+/rIC+ neurons. Rs: Spearman rank-order correlation coefficient; p value of the Spearman correlation, p values <0.05 are considered to be significant. E, Rank-order correlation of the TC-EPSC onto nearby neurons that are not recurrently connected. Note that all neurons were recorded within a 100 μm × 100 μm area of interest in L4 and often rIC− neurons were recorded in the same quadruplet with rIC+ ones. Rs: Spearman rank-order correlation coefficient; p value of the Spearman correlation. F, Diagram of recording configuration for L6. Light pulses activate the LGN terminal fields in V1, while multiple patch-clamp recordings are obtained from pyramidal neurons in L6 within a 100 μm × 100 μm area of interest. Light intensity: 0.3 mW/mm2. G, Pie chart indicating the proportion of neurons not responding to light activation of TC axons (black, TC−/rIC−), of neurons not responding to TC activation but recurrently connected (dark blue, TC−/rIC+), of neurons responsive to TC activation but not recurrently connected (gray, TC+/rIC−), and of neurons responsive to TC activation and recurrently connected in L6 (light blue, TC+/rIC+). H, Rank-order correlation of TC-EPSC amplitude onto TC+/rIC− neurons. Rs: Spearman rank-order correlation coefficient; p value of the Spearman correlation.
Figure 5.
Figure 5.
Layer-specific experience-dependent depression of TC-EPSCs. A, Example traces of TC-EPSCs evoked in L4 star pyramids by light activation of TC afferents in control (black) and deprived (gray) slices. Light intensity: 0.3 mW/mm2. B, Input/output curve of TC-EPSCs in L4. Control, Black; deprived, gray. C, Plot of PPR in response to stimulation at 0.3 mW/mm2 and different frequencies. Control, Black; deprived, gray. D, Bar plot of average latency of L4 TC-EPSC onset from onset of light pulse and decay time constant of L4 TC-EPSCs. Light intensity: 0.3 mW/mm2. Control, Black; deprived, gray. E, Example traces of TC-EPSCs evoked in L6 pyramidal neurons by light activation of TC afferents in control (black) and deprived (gray) slices. Light intensity: 0.3 mW/mm2. F, Input/output curve of TC-EPSCs from L6 pyramidal neurons. Control, Black; deprived, gray. G, Plot of PPR in response to stimulation at different frequencies. Light intensity: 0.3 mW/mm2. Control, Black; deprived, gray. H, Bar plot of average latency of L6 TC-EPSC onset from the onset of the light pulse and decay time constant of L6 TC-EPSCs. Light intensity: 0.3 mW/mm2. Control, Black; deprived, gray. Data are presented as mean ± SE, asterisks indicate significant differences.
Figure 6.
Figure 6.
MD does not affect the organization of TC/rIC inputs onto L6 pyramidal neurons. A, Pie charts of the proportion of L6 pyramidal neurons not responding to light activation of TC afferents and not recurrently connected (black, TC−/rIC−), of L6 pyramidal neurons not responding to light activation of TC afferents but recurrently connected (dark blue, TC−/rIC+), of L6 pyramidal neurons responding to light activation of TC afferents and not recurrently connected (gray, TC+/rIC−), and of L6 pyramidal neurons responding to light activation of TC afferents and recurrently connected (light blue, TC+/rIC+). Left chart, Control hemisphere (C); right chart, deprived hemisphere (MD). B, Distribution of TC-EPSC amplitudes for L6 TC+/rIC− pyramidal neurons. Light intensity: 0.3 mW/mm2. Control, Black dotted line; deprived, gray solid line.
Figure 7.
Figure 7.
Experience-dependent reorganization of TC/IC inputs onto L4 star pyramids. A, Pie charts of the proportion of L4 star pyramids not responsive to activation of TC afferents and not recurrently connected (black, TC−/rIC−), of L4 star pyramids responsive to activation of TC afferents and not recurrently connected (gray, TC+/rIC−), and of recurrently connected L4 star pyramids that responded to light activation of TC afferents (light blue, TC+/rIC+). Left chart, Control hemisphere (C); right chart, deprived hemisphere (MD). B, Bar plot of average amplitude of TC-EPSC onto TC+/rIC+ L4 star pyramids, of TC-EPSCs onto TC+/rIC− star pyramids, and of rIC-EPSP between L4 star pyramids. Light intensity: 0.3 mW/mm2. Control, Black; deprived, gray. Data are represented as average ± SE; asterisks indicate significant differences. C, Distribution of TC-EPSC amplitudes onto TC+/rIC− L4 star pyramids. Control, Dashed black line; deprived, gray line. Note that the entire distribution is shifted toward smaller amplitudes. D, Distribution of TC-EPSC amplitudes onto TC+/rIC+ star pyramids in L4. Control, Dashed black line; deprived, light blue line. Arrow, Peak of the distribution strongly affected by MD. Inset, Spearman rank-order correlation of TC-EPSP amplitudes onto presynaptic (Pre) and postsynaptic (Post) neurons of TC+/rIC+ L4 star pyramids. Note the MD-induced loss of correlation compared with control conditions (see Fig. 4D). Rs: Spearman rank-order correlation coefficient; p value of the Spearman correlation.

Similar articles

Cited by

References

    1. Alonso JM, Usrey WM, Reid RC. Rules of connectivity between geniculate cells and simple cells in cat primary visual cortex. J Neurosci. 2001;21:4002–4015. - PMC - PubMed
    1. Amitai Y. Thalamocortical synaptic connections: efficacy, modulation, inhibition and plasticity. Rev Neurosci. 2001;12:159–173. - PubMed
    1. Andolina IM, Jones HE, Wang W, Sillito AM. Corticothalamic feedback enhances stimulus response precision in the visual system. Proc Natl Acad Sci U S A. 2007;104:1685–1690. - PMC - PubMed
    1. Antonini A, Fagiolini M, Stryker MP. Anatomical correlates of functional plasticity in mouse visual cortex. J Neurosci. 1999;19:4388–4406. - PMC - PubMed
    1. Banitt Y, Martin KA, Segev I. A biologically realistic model of contrast invariant orientation tuning by thalamocortical synaptic depression. J Neurosci. 2007;27:10230–10239. - PMC - PubMed

Publication types

MeSH terms

Substances