. 2013 May 1;126(Pt 9):1952-61.
doi: 10.1242/jcs.117184. Epub 2013 Feb 27.

Mitochondrial aldehyde dehydrogenase-2 activation prevents β-amyloid-induced endothelial cell dysfunction and restores angiogenesis

Affiliations

Mitochondrial aldehyde dehydrogenase-2 activation prevents β-amyloid-induced endothelial cell dysfunction and restores angiogenesis

Raffaella Solito et al. J Cell Sci. .

Abstract

Amyloid β peptides (Aβ1-40 and Aβ1-42) cause cerebral degeneration by impairing the activity of angiogenic factors and inducing apoptosis and senescence in the endothelium. Amyloid peptides are known to induce oxidative stress. Impairment of mitochondrial aldehyde dehydrogenase 2 (ALDH2) following oxidative stress, results in accumulation of toxic aldehydes, particularly 4-hydroxynoneal (4-HNE). We sought to determine the role of mitochondrial ALDH2 in Aβ-related impairment of angiogenesis. We hypothesized that by increasing the detoxification activity of ALDH2 we would reduce Aβ-driven endothelial injuries and restore angiogenesis. We used a selective ALDH2 activator, Alda-1, assessing its ability to repair mitochondrial dysfunction in the endothelium. Treatment of human endothelial cells with Aβ1-40 (5-50 µM) induced loss of mitochondrial membrane potential, increased cytochrome c release and ROS accumulation. These events were associated with 4-HNE accumulation and decrease in ALDH2 activity (40%), and resulted in disassembly of endothelial junctions, as evidenced by β-catenin phosphorylation, disorganization of adherens and tight junctions, and by disruption of pseudocapillary formation. Alda-1 (10-40 µM) abolished Aβ-induced 4-HNE accumulation, apoptosis and vascular leakiness, fully restoring the pro-angiogenic endothelial phenotype and responses to FGF-2. Our data document that mitochondrial ALDH2 in the endothelium is a target for the vascular effect of Aβ, including loss of barrier function and angiogenesis. ALDH2 activation, by restoring mitochondrial functions in the endothelium, prevents Aβ-induced dysfunction and anti-angiogenic effects. Thus, agents activating ALDH2 may reduce endothelial injuries including those occurring in cerebral amyloid angiopathy, preserving the angiogenic potential of the endothelium.

Keywords: Aldehyde dehydrogenase 2; Amyloid β; Angiogenesis; Mitochondria.


Figures

Fig. 1.
Fig. 1.
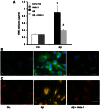
Aβ decreases mitochondrial membrane potential in endothelial cells. (A) Mitochondrial membrane potential in HUVEC exposed to Aβ (5–50 µM, 30 minutes), with or without Alda-1 pretreatment (20 µM, 30 minutes prior Aβ), were measured using the JC-1 probe. The fluorescence units plotted were obtained by subtracting background fluorescence (**P<0.01 and ***P<0.001 versus control, n = 3). Aβ40–1 activity (X) was used as the control. (B) Western blot analysis of cytochrome c release following Aβ treatment (50 µM, 30 minutes) with or without Alda-1 (20 µM, 30 minutes prior Aβ). A representative gels of three independent experiments is shown. (C) Mitochondrial generation of superoxide in HUVEC, detected by MitoSox fluorescence staining. Aβ (50 µM, 30 minutes), Alda-1 (20 µM, 30 minutes prior Aβ). Scale bar: 100 µm. Quantification of superoxide generation is expressed as percentage of stained cells after treatment compared with the control. (</emph>± s.e.m.; n = 3). (D) Mitochondrial membrane potential in HBMEC exposed to Aβ with or without Alda-1 (20 µM, 30 minutes prior Aβ), measured using the JC-1 probe and expressed as described in A. **P<0.01 and ***P<0.001 versus control. Data are means ± s.e.m.; n = 3–4 emission values. Aβ40–1 activity (X) was used as the control. (E) Western blot analysis of cytochrome c release in HBMEC treated as above. A representative gels of three independent experiments is shown. (F) Superoxide mitochondrial generation, detected by MitoSox, in HBMEC treated as above. Scale bar: 100 µm. Quantification of superoxide generation is expressed as percentage of stained cells after treatment compared with the control. (± s.e.m.; n = 3).
Fig. 2.
Fig. 2.
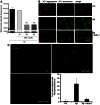
Aβ increases 4-HNE adduct formation. (A) Accumulation of 4-HNE adducts in HUVEC treated as in Fig. 1A was measured by ELISA. *P<0.05 versus Ctr.; #P<0.05 versus Aβ. Values are means ± s.e.m. of three experiments. (B) 4-HNE detection by immunohistochemistry in HUVEC treated as above. (C) 4-HNE and TOM20 detection by immunohistochemistry in HUVEC treated as above. Scale bar: 10 µm.
Fig. 3.
Fig. 3.
Alda-1 prevents Aβ-induced mitochondrial dysfunction. (A) Quantification of JC-1 monomer fluorescence induced by Aβ in HUVEC pretreated with Alda-1, in the concentration range 10–40 µM. Data are expressed as in Fig. 1A (means ± s.e.m., n = 3; ***P<0.001). Aβ40–1 activity (X) was used as the control. (B) Mitochondrial membrane potentials were assessed by confocal microscopy, showing the relative abundance of JC-1 aggregates (red) and monomers (green). (Upper panels) Control cells; (middle panels) Aβ-treated cells; (lower panels) cells treated with Alda-1-Aβ combined as in Fig. 1A. Scale bar: 10 µm. (C) Phosphatidylserine exposure, assessed by immunohistochemistry, in HUVEC treated for 18 hours with 50 µM Aβ with or without Alda-1. Scale bar: 100 µm.
Fig. 4.
Fig. 4.
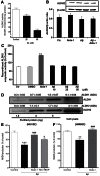
Aβ inhibits ALDH2 activity in endothelial cells. (A) Decline of ALDH2 activity, measured by the formation of NADH in HUVEC exposed to Aβ. Values are mean ± s.e.m. NADH production (n = 3–6). (B) Western blot analysis of ALDH2 expression in HUVEC treated with Aβ (25 µM), with or without Alda-1 (20 µM). Quantification of gels are presented as the ratio to β actin (n = 3). (C) Recombinant ALDH2 activity in the absence or presence of Aβ or Alda-1. Data are percentage NADH production over that of the control (± s.e.m. of three independent experiments). (D) Expression of ALDH2 and ALDH1 levels in HUVEC determined by western blot analysis. Known amounts of purified recombinant ALDH1 and ALDH2 (1.5–5 ng) were used for a standard curve to obtain the values given above the blots (means ± s.e.m. of three independent experiments). (E,F) Recovery of ALDH2 enzyme activity in HUVEC (E) and HMBEC (F) after Alda-1 (20 µM) or MnTbap (100 µM) treatment 30 minutes before exposure to Aβ (50 µM). **P<0.01 and ***P<0.001 versus control; ###P<0.001 and §P<0.05 versus Aβ.
Fig. 5.
Fig. 5.
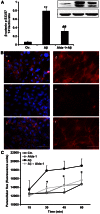
Aβ induces phosphorylation of β-catenin, and impairs endothelial adherens and tight junction organization and barrier function. (A) Western blot analysis of phosphorylated β-catenin at Ser33/37 and Thr41, in HUVEC treated with Aβ (50 µM) in the presence or absence of Alda-1 (20 µM). Quantifications are presented as a ratio to β actin (n = 3; **P<0.01 versus Ctr., ##P<0.01 versus Aβ treatment). (B) ZO-1 and VE-cadherin expression pattern in control cells (a,d), cells exposed to Aβ (50 µM; b,e) and cells pretreated with Alda-1 (20 µM, 30 minutes) and then exposed to Aβ (c,f). Scale bar: 50 µm (C) Increased permeability of HUVEC monolayers exposed to Aβ (50 µM) in presence or absence of Alda-1 (20 µM), detected as passage of fluorescence-conjugated FITC-dextran. Each point is the mean ± s.e.m. of 3 experiments, *P<0.05 versus Aβ.
Fig. 6.
Fig. 6.
Alda-1 preserves the ability of the endothelium to form pseudocapillaries and restores responsiveness to FGF-2. (A) Pseudocapillary formation in Matrigel by HUVEC exposed to Aβ (25 µM) with or without Alda-1 (20 µM) or FGF-2 (20 ng/ml), observed by microscopy 18 hours after cell seeding. (a) Control (Aβ40–1) cells, (b) Aβ-treated, (c) combined Aβ and Alda-1-Aβ-treated, (d) FGF-2-treated, (e) combined FGF-2 and Aβ treated, (f) combined FGF-2, Aβ and Alda-1 treated cells. Images represent three experiments. Scale bar: 20 µm. (i and iii) Representative images at 4× magnification of pseudocapillary network in control cells or after FGF-2 treatment (ii) Endothelial cell morphology after 18 hours of treatment with Aβ. Scale bars: 100 µm. (B) Quantification of pseudocapillaries. Values are means ± s.e.m.; n = 3 (***P<0.001 versus control; ###P<0.001 versus Aβ). (C), Formation of pseudocapillaries from HUVEC 2 days after seeding on cytodex microcarriers embedded in fibrin gel. Representative images of capillary formation in control condition (Aβ40–1; a), after FGF-2 stimulation (b), after FGF-2+Aβ treatment (c) and FGF-2+Aβ+Alda-1 treatment (d). Scale bar: 50 µm. (D) Quantification of pseudocapillaries. The number of grid units required to cover the entire pseudocapillary surface (means ± s.e.m.; n = 3). ###P<0.001 versus control; ***P<0.001 versus Aβ.
Fig. 7.
Fig. 7.
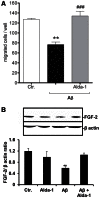
Alda-1 preserves endothelial cell migration and FGF-2 expression. (A) Cell migration determined using a Boyden chamber. Values are means ± s.e.m. of 3 experiments (**P<0.01 versus control; ###P<0.001 versus Aβ). (B) Western blot analysis of FGF-2 production in HUVEC treated with Aβ in the presence or absence of Alda-1. Quantification of gels are presented as the ratio to β-actin (n = 3). **P<0.001.

Similar articles

Cited by

References

    1. Aliev G., Seyidova D., Lamb B. T., Obrenovich M. E., Siedlak S. L., Vinters H. V., Friedland R. P., LaManna J. C., Smith M. A., Perry G. (2003). Mitochondria and vascular lesions as a central target for the development of Alzheimer's disease and Alzheimer disease-like pathology in transgenic mice. Neurol. Res. 25, 665–674 10.1179/016164103101201977 - DOI - PubMed
    1. Cantara S., Thorpe P. E., Ziche M., Donnini S. (2007). TAT-BH4 counteracts Abeta toxicity on capillary endothelium. FEBS Lett. 581, 702–706 10.1016/j.febslet.2007.01.037 - DOI - PubMed
    1. Chen C. H., Budas G. R., Churchill E. N., Disatnik M. H., Hurley T. D., Mochly-Rosen D. (2008). Activation of aldehyde dehydrogenase-2 reduces ischemic damage to the heart. Science 321, 1493–1495 10.1126/science.1158554 - DOI - PMC - PubMed
    1. Chen X. L., Nam J-O., Jean C., Lawson C., Walsh C. T., Goka E., Lim S. T., Tomar A., Tancioni I., Uryu S. et al.(2012). VEGF-induced vascular permeability is mediated by FAK. Dev. Cell 22, 146–157 10.1016/j.devcel.2011.11.002 - DOI - PMC - PubMed
    1. Cho D. H., Nakamura T., Fang J., Cieplak P., Godzik A., Gu Z., Lipton S. A. (2009). S-nitrosylation of Drp1 mediates β-amyloid-related mitochondrial fission and neuronal injury. Science 324, 102–105 10.1126/science.1171091 - DOI - PMC - PubMed

Publication types

MeSH terms