

Prevalence of multinucleotide replacements in evolution of primates and Drosophila
- PMID: 23447710
- PMCID: PMC3649671
- DOI: 10.1093/molbev/mst036
Prevalence of multinucleotide replacements in evolution of primates and Drosophila
Abstract
Evolution of sequences mostly involves independent changes at different sites. However, substitutions at neighboring sites may co-occur as multinucleotide replacement events (MNRs). Here, we compare noncoding sequences of several species of primates, and of three species of Drosophila fruit flies, in a phylogenetic analysis of the replacements that occurred between species at nearby nucleotide sites. Both in primates and in Drosophila, the frequency of single-nucleotide replacements is substantially elevated within 10 nucleotides from other replacements that occurred on the same lineage but not on another lineage. The data imply that dinucleotide replacements (DNRs) affecting sites at distances of up to 10 nucleotides from each other are responsible for 2.3% of single-nucleotide replacements in primate genomes and for 5.6% in Drosophila genomes. Among these DNRs, 26% and 69%, respectively, are in fact parts of replacements of three or more trinucleotide replacements (TNRs). The plurality of MNRs affect nearby nucleotides, so that at least six times as many DNRs affect two adjacent nucleotide sites than sites 10 nucleotides apart. Still, approximately 60% of DNRs, and approximately 90% of TNRs, span distances more than two (or three) nucleotides. MNRs make a major contribution to the observed clustering of substitutions: In the human-chimpanzee comparison, DNRs are responsible for 50% of cases when two nearby replacements are observed on the human lineage, and TNRs are responsible for 83% of cases when three replacements at three immediately adjacent sites are observed on the human lineage. The prevalence of MNRs matches that is observed in data on de novo mutations and is also observed in the regions with the lowest sequence conservation, suggesting that MNRs mainly have mutational origin; however, epistatic selection and/or gene conversion may also play a role.
Keywords: D. melanogaster; H. sapiens; complex mutations; multinucleotide replacements; mutagenesis.
Figures
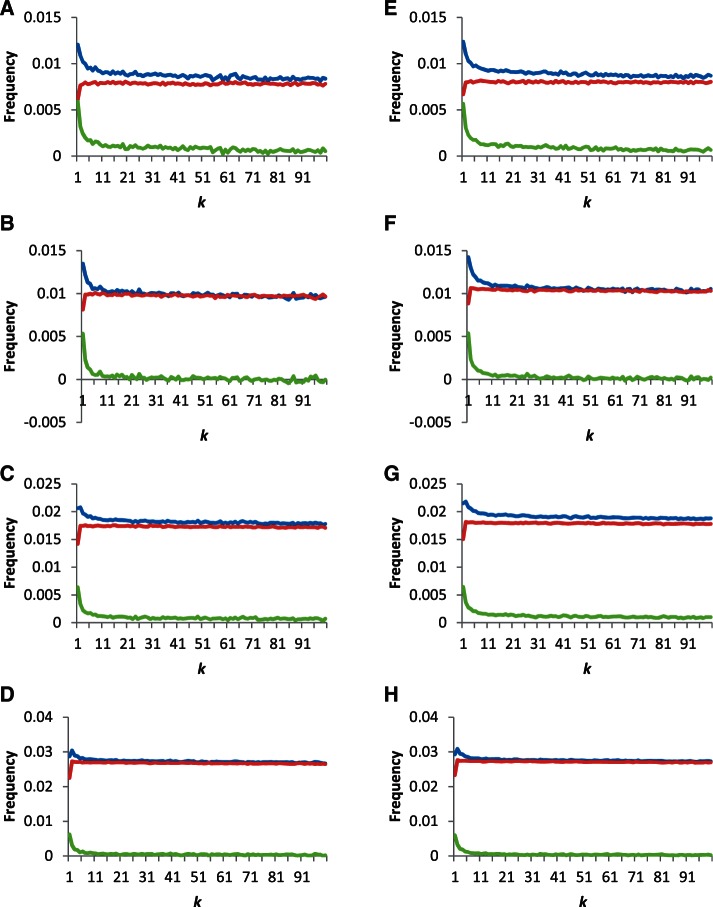
 between the sites (horizontal axis). Left column (A–D), introns; right column (E–H), intergenic regions. (A,E) Homo sapiens and Pan troglodytes (Gorilla gorilla as outgroup), (B,F) H. sapiens and G. gorilla (Pongo pygmaeus as outgroup), (C,G) H. sapiens and P. pygmaeus (Macaca mulatta as outgroup), and (D,H) H. sapiens and M. mulatta (Callithrix jacchus as outgroup). CpG dinucleotides are excluded, which leads to underestimation of dd(1) and sd(1) (see Materials and Methods).
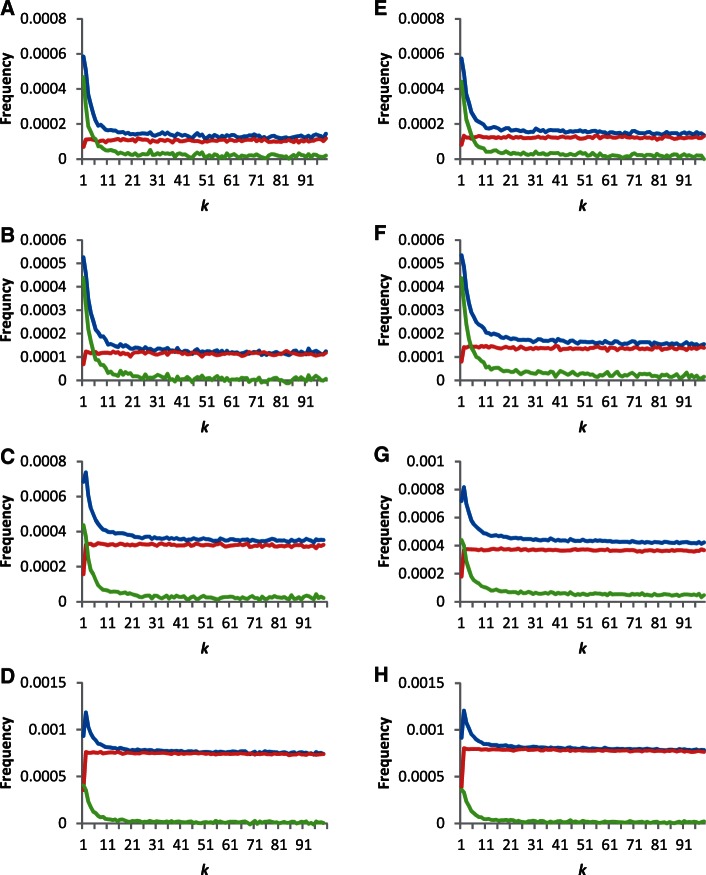
 (horizontal axis). The panels correspond to the panels in figure 2.
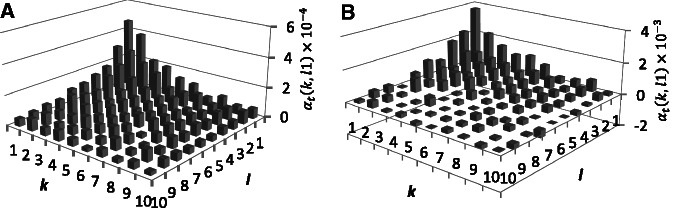
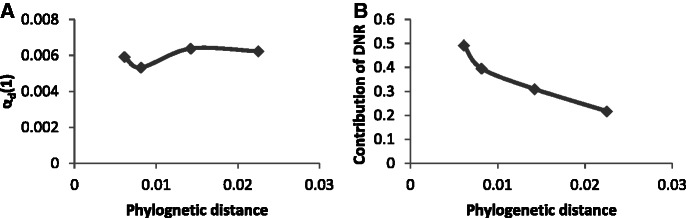
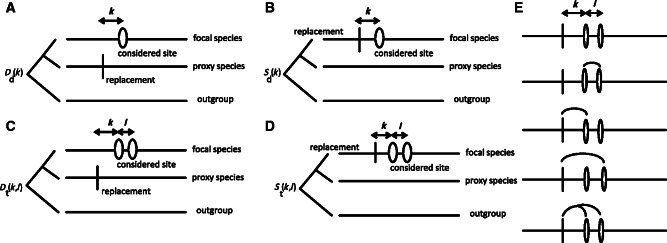
 as the function of
  and (B)
  as the function of
  . At each panel, the four points, from left to right, correspond to the substitutions on the Homo sapiens lineage after its divergence from Pan troglodytes, Gorilla gorilla, Pongo pygmaeus, and Macaca mulatta, respectively.
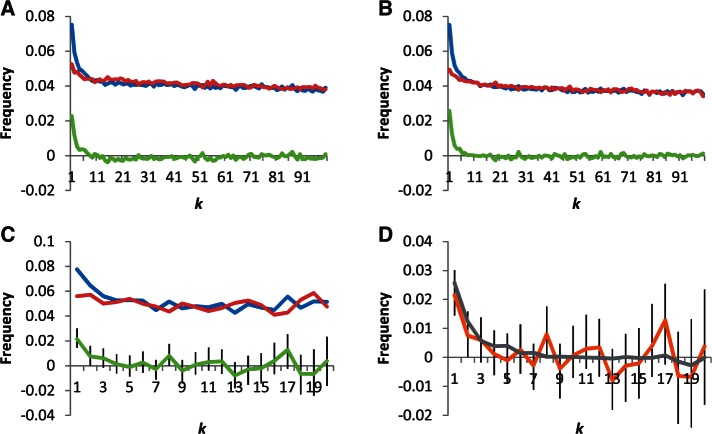
 between the sites (horizontal axis). (A) Introns; (B) intergenic regions; and (C) positions 8–30 in introns with lengths up to 120 nucleotides. (D) αd(k) for all intronic sites (gray) and positions 8–30 in introns with lengths up to 120 nucleotides (orange) plotted together. The differences between the two curves are insignificant for all k. Error bars for αd(k) correspond to 95% confidence intervals obtained by 1,000 bootstrap simulations; for data from all intronic sites and intergenic regions, they are not shown because they would be barely visible.
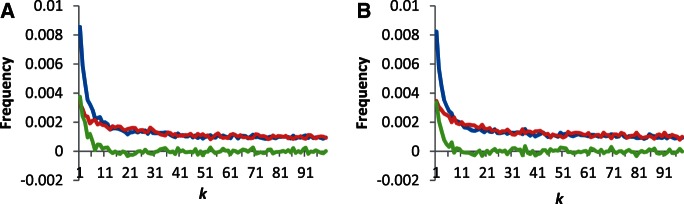
 between sites (horizontal axis). (A) Introns and (B) intergenic regions.
References
-
- Altschul S, Gish W, Miller W, Myers E, Lipman D. Basic local alignment search tool. J Mol Biol. 1990;215(3):403–410. - PubMed
-
- Andolfatto P. Adaptive evolution of non-coding DNA in Drosophila. Nature. 2005;437:1149–1152. - PubMed
-
- Averof M, Rokas A, Wolfe KH, Sharp PM. Evidence for a high frequency of simultaneous double-nucleotide substitutions. Science. 2000;287:1283–1286. - PubMed
Publication types
MeSH terms
LinkOut - more resources
Full Text Sources
Other Literature Sources
Molecular Biology Databases
