. 2013 Jun;12(3):435-45.
doi: 10.1111/acel.12060. Epub 2013 Mar 27.

Oxidative stress activates a specific p53 transcriptional response that regulates cellular senescence and aging

Affiliations
Free PMC article

Oxidative stress activates a specific p53 transcriptional response that regulates cellular senescence and aging

Valentina Gambino et al. Aging Cell. 2013 Jun.
Free PMC article

Erratum in

  • Corrigendum.
    [No authors listed] [No authors listed] Aging Cell. 2019 Jun;18(3):e12962. doi: 10.1111/acel.12962. Aging Cell. 2019. PMID: 31087759 Free PMC article. No abstract available.

Abstract

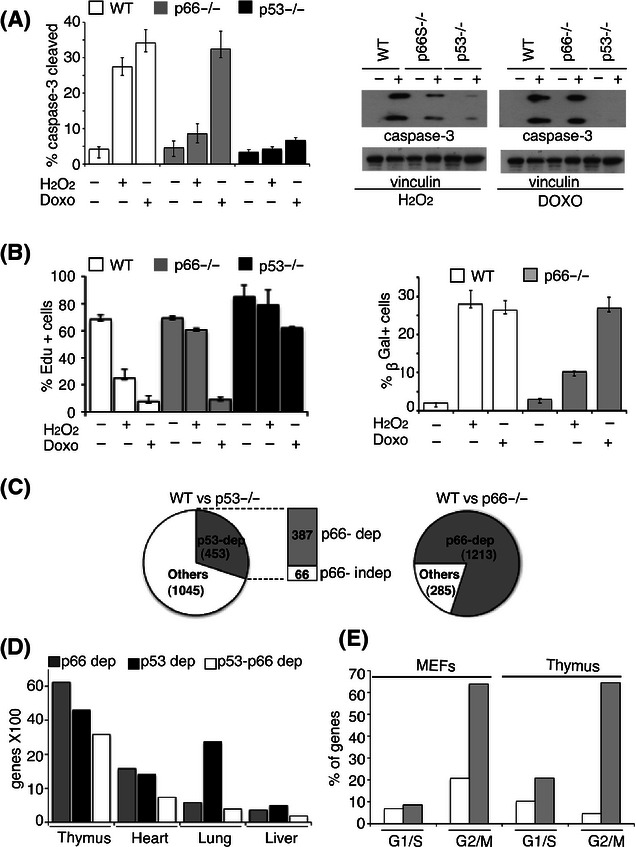
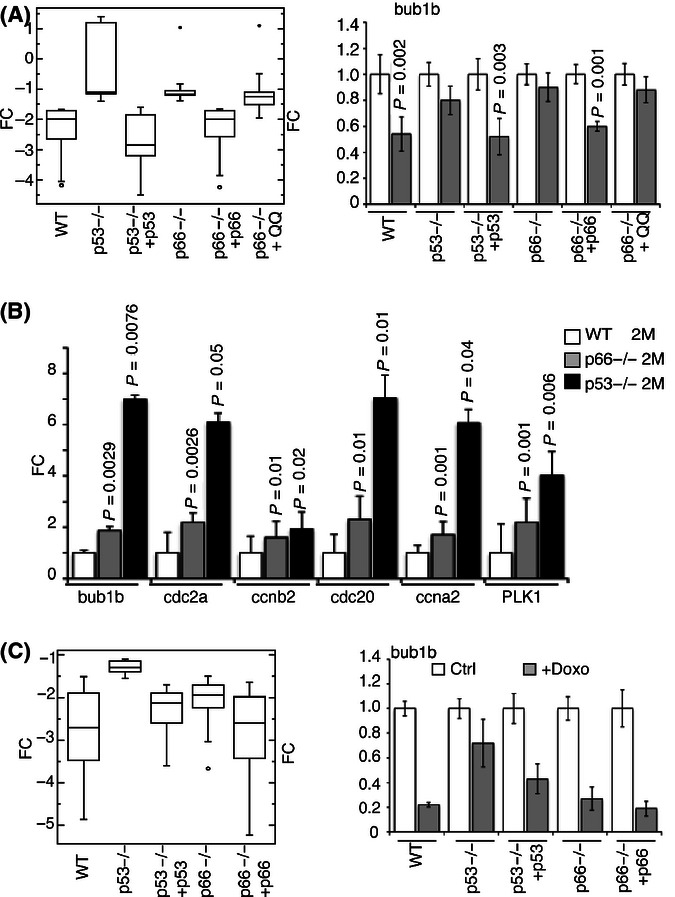
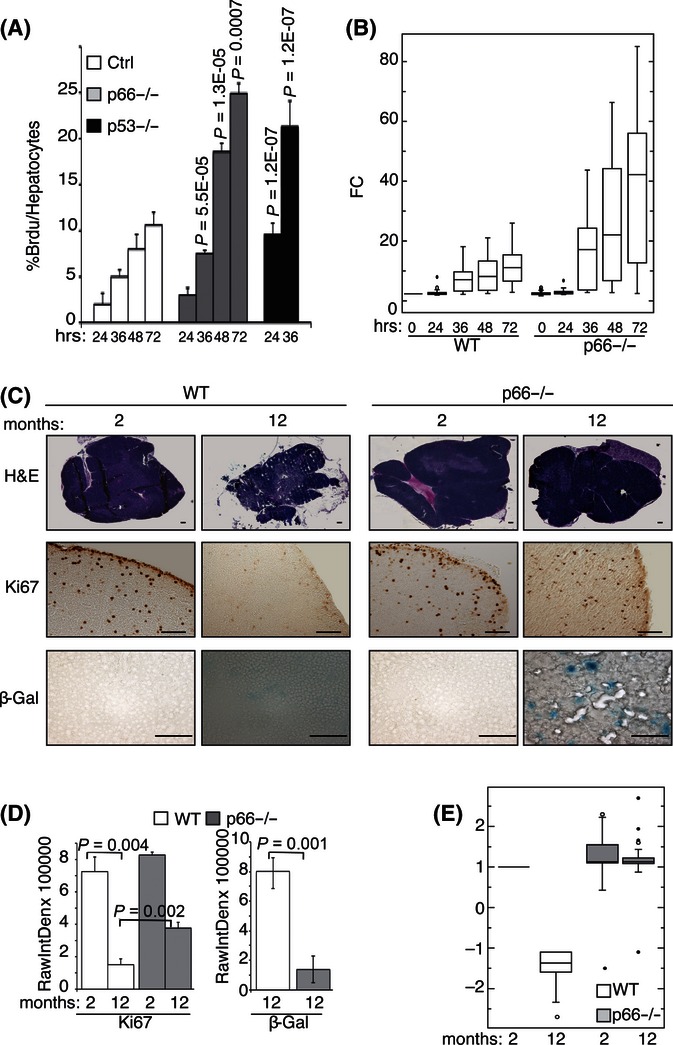
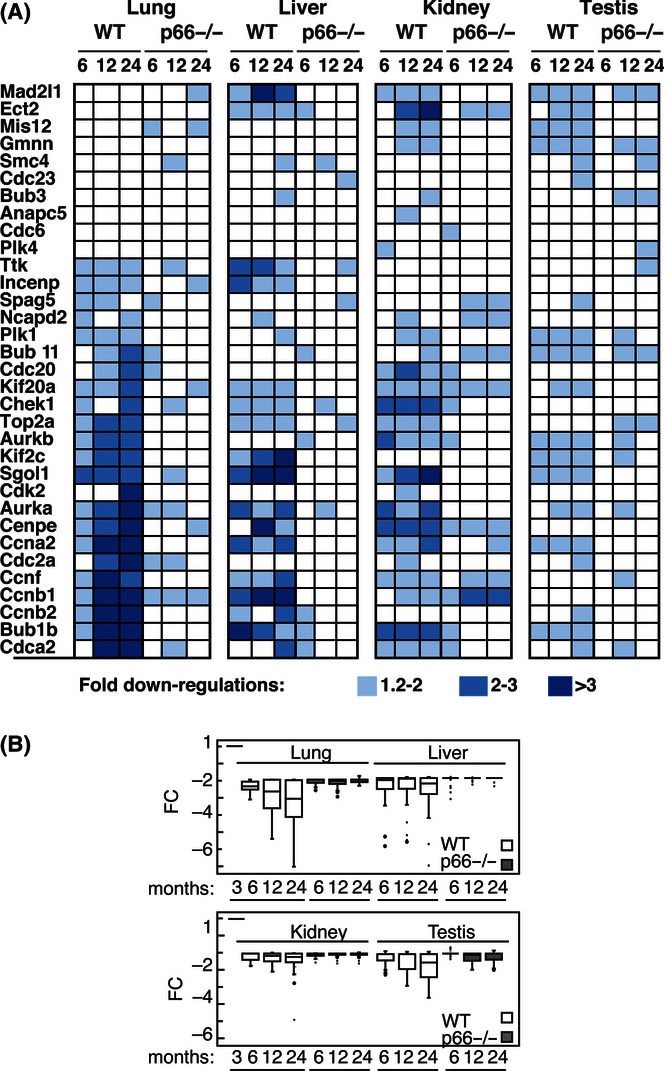
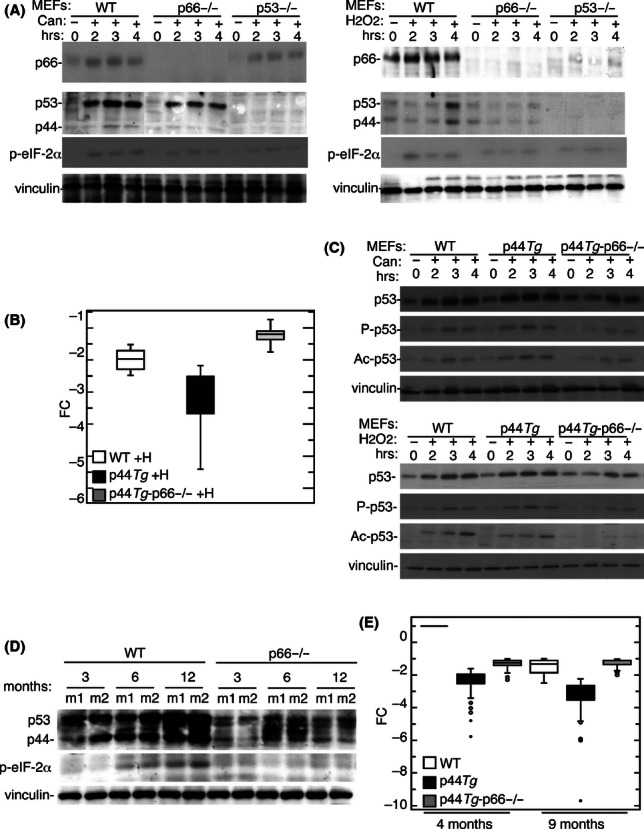
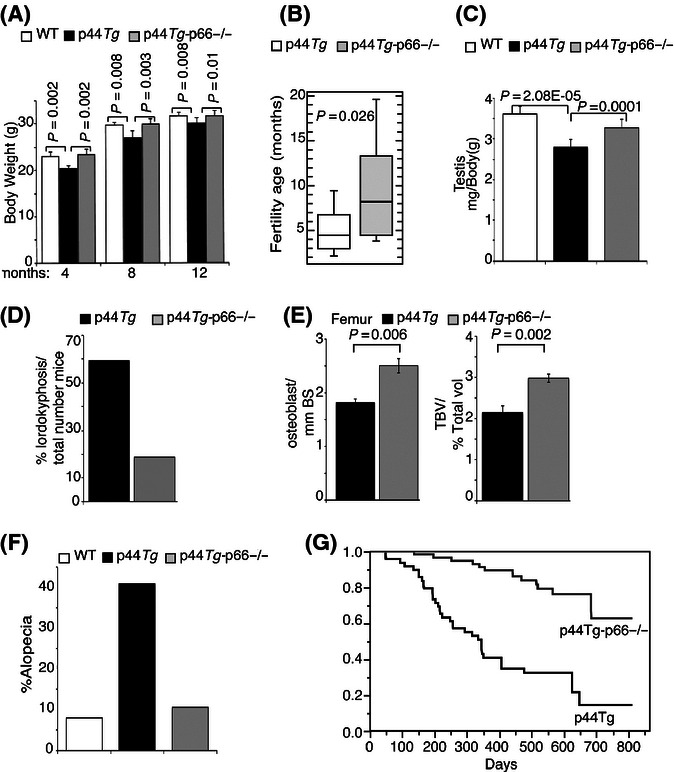
Oxidative stress is a determining factor of cellular senescence and aging and a potent inducer of the tumour-suppressor p53. Resistance to oxidative stress correlates with delayed aging in mammals, in the absence of accelerated tumorigenesis, suggesting inactivation of selected p53-downstream pathways. We investigated p53 regulation in mice carrying deletion of p66, a mutation that retards aging and confers cellular resistance and systemic resistance to oxidative stress. We identified a transcriptional network of ~200 genes that are repressed by p53 and encode for determinants of progression through mitosis or suppression of senescence. They are selectively down-regulated in cultured fibroblasts after oxidative stress, and, in vivo, in proliferating tissues and during physiological aging. Selectivity is imposed by p66 expression and activation of p44/p53 (also named Delta40p53), a p53 isoform that accelerates aging and prevents mitosis after protein damage. p66 deletion retards aging and increases longevity of p44/p53 transgenic mice. Thus, oxidative stress activates a specific p53 transcriptional response, mediated by p44/p53 and p66, which regulates cellular senescence and aging.


Figures

Fig. 1
Fig. 1
p66 is required for oxidative stress-induced senescence and apoptosis. (A) Apoptosis analysis by FACS (left) and Western blot (right) of cleaved caspase-3 expression in WT, p66−/− and p53−/− MEFs after H2O2 or Doxorubicin (Doxo) treatment; (n = 3 Error bars represent standard deviation (SD). (B) EdU (5-ethynyl-2′-deoxyuridine) incorporation (left) and β-Gal quantification (right) of WT, p66−/− and p53-/- MEFs after H2O2 or Doxo treatment; average of 3 independent experiments. Error bars represent SD. (C) The two pies show the number of statistically significant H2O2-induced gene-regulations in WT MEFs (n = 1498), and their dependence on p53 (n = 453; left pie) or p66 (n = 1213; right pie) expression, as derived from the comparison of the WT vs. p53−/− or p66−/− datasets, respectively. The bar of pie (left pie) shows the number of p53-dependent regulations that were also dependent on p66 expression (n = 387) or not (n = 66). (D) The graph shows the number of genes regulated by p66, p53 or both in the indicated tissues in physiological conditions. (E) Distribution (percentage) of the genes regulated by p53 and p66 in both H2O2-treated MEFs and thymus (up- or down-regulations), according to their indicated functions in the cell-cycle.
Fig. 2
Fig. 2
Q-PCR validation of p53-p66 dependent regulations of G2-M genes in MEFs and thymus. (A) Left: Box plot representation of Q-PCR fold-changes (FC) for 19 G2-M genes in H2O2-treated MEFs (compared with untreated controls): WT, p53−/−, p53−/− + p53 (p53−/− MEFs reconstituted with WT p53), p66−/−, p66−/− + p66 (p66−/− MEFs reconstituted with WT p66), and p66−/− + QQ (p66−/− MEFs reconstituted with the p66 redox-mutant QQ). Right, representative example: mRNA-expression levels of the bub1b gene in control and H2O2 treated MEFs with the indicated genotypes by Q-PCR analysis. (B) Significant up-regulation of the mRNA levels of several G2/M genes in 2-month-old p66−/− and p53−/− thymuses compared to WT organs (QPCR, 8 animals per genotype). (C) Left: Box plot representation of Q-PCR FC for 18 G2-M genes in Doxo-treated MEFs (compared with untreated controls): WT, p66−/−, p53−/−, p53−/− + p53 (p53−/− MEFs reconstituted with WT p53), p66−/− + p66 (p66−/− MEFs reconstituted with WT p66). Right, representative example: mRNA-expression levels of the bub1b gene in control and Doxo-treated MEFs with the indicated genotypes by Q-PCR analysis. FC are compared with untreated controls; error bars represent SD; (H2O2- independent experiments: n = 4; Doxo- independent experiments: n = 2). Significant P-values are indicated(two-tailed t-test). The lower and the upper edges of each box plot are the 1st and 3rd quartile, respectively (inter quartile range, IQR). The line in the middle of the box represents the median. The observations beyond the fences are denoted as circles and are considered outliers.
Fig. 3
Fig. 3
p53 and p66 down-regulate G2-M genes in the thymus during physiological aging and in proliferating liver cells. (A) Higher percentage of proliferating cells in p66−/− regenerating liver. Quantitative analysis of BrdU staining during liver regeneration of 2-month-old WT, p66−/− and p53−/− mice: liver samples were collected before resection (time zero, T0; preoperative livers) and 24, 36, 48 and 72 h after partial hepatectomy. Error bars represent SD; average of 2 independent experiments on a total of 6 animals per group. Ratio of BrdU positive to 600 Dapi positive hepatocytes at every time-point are represented; significant P-values are indicated (two-tailed t-test that were done by comparing data set of p66−/− or p53−/−at each time-point with the corresponding data set of WT samples). (B) G2-M genes are regulated during hepatic regeneration. Box plot representation of Q-PCR fold-changes (FC) for 18 of the G2-M genes on RNAs from livers of 2-month-old WT and p66−/− mice during hepatic regeneration. For each sample we pooled RNAs from 3 animals. Average of 2 independent experiments is represented. (C,D) Delayed aging in p66−/− thymus. (C) Representative images from 3 independent experiments showing H&E (top, digital reconstructions), Ki67 (centre) and β-Gal (bottom) staining of thymuses from 2- and 12-month-old WT and p66−/− mice. Scale bar: 200 μm. (D) Quantification of the frequency of Ki-67- (left) and β-Gal- (right) positive cells. P-values with respect to WT are indicated. (E) Box plot representation of the Q-PCR FC for 33 G2-M genes in 2- and 12-month-old p66−/− thymuses compared to 2-month-old WT organs (FC=1); n = 8 animals per genotype.
Fig. 4
Fig. 4
p53/p66 transcriptional-response to oxidative stress is activated during physiological aging. (A,B) Q-PCR analysis of lung, liver, kidney, and testis from 3, 6, 12 and 24 month-old WT and p66−/− mice. Heatmap (A) and box plot (B) representations of the expression profile of 31 G2-M genes significantly downregulated during physiological aging. For each gene, averaged tissue expression (2 mice per genotype per age group) at the indicated ages is compared with that of the corresponding tissue of 3-month-old mice (FC=1). (A) Darker blue colours indicate greater fold changes. (B) The lower and the upper edges of the box are the 1st and 3rd quartile, respectively (inter quartile range, IQR). The line in the middle of the box represents the median. The observations beyond the fences are denoted as circles and are considered outliers.
Fig. 5
Fig. 5
p66 loss interferes with p53/p44 activation upon endoplasmic reticulum (ER) stress. (A) Western blot analysis of proteins extracted from control and treated [canavanine (left) or H2O2 (right)] WT, p66−/− and p53−/− MEFs at the indicated time-points. Immunoblotting was performed with antibodies against: P-eIF2α, p66, p53 (AI25-13, anti-full length p53), and vinculin. (B) Effect of p66 deletion on the expression of 31 G2-M genes in p44Tg samples. Box plot representation of Q-PCR fold-changes (FC), with respect to the untreated controls, for the G2-M genes in H2O2-treated WT (WT+H), p44Tg (p44Tg+H) and p44Tg/p66−/− (p44Tg-p66−/−+H) MEFs. Average of 3 independent experiments. (C) Western blot analysis of proteins extracted from control and treated [canavanine (upper) or H2O2 (lower)] WT, p44Tg and p44Tg-p66−/− MEFs at the indicated timepoints. Immunoblotting was performed with antibodies against: p53 (DO-1, anti-N-terminal region), phosphorylated-p53 (P-p53), acetylated-p53 (Ac-p53) and vinculin. (D) Western blot analysis of proteins extracted from liver of 3, 6 and 12 month-old WT and p66−/− mice (m1, m2: 2 mice for each age group). Immunoblotting was performed with anti-p53 (AI25-13, anti full-length p53), anti-P-eIF2α and anti-vinculin antibodies. (E) Box plot representation of Q-PCR FC for the expression of G2-M genes in the thymuses of 4 and 9 month-old WT, p44Tg and p44Tg/p66−/− mice (4 animals per genotype). FC are compared with those of 4-month-old WT mice (FC=1).
Fig. 6
Fig. 6
Effects of p66 on the aging-phenotypes of p44Tg mice. (A) Body weight of WT, p44Tg and p44Tgp66−/− mice at 4, 8 and 12 weeks of age; average of 10 males per group.(B) Box plot representation of the last fertile age (in months) of p44Tg and p44Tg-p66−/− mice (20 males per group). The lower and the upper edges of the box are the 1st and 3rd quartile, respectively (inter quartile range, IQR). The line in the middle of the box represents the median (5.6 months for p44Tg and 8.5 months for p44Tg-p66−/−). (C) Testis weight of 5-month-old WT, p44Tg and p44Tg-p66−/− mice (average from 10 mice per group) (D) Percentage of lordokyphosis in p44Tg and p44Tg-p66−/−mice (n = 60). (E) Histomorphometric analysis of H&E sections (Fig. S10B) from the femur of different p44Tg and p44Tg-p66−/−mice of the same age (9 months; n = 3). Left: osteoblast number/bone surface ratio (osteoblast/mm BS). Right: trabecular bone volume (TBV). (F) Percentage of alopecia in 7-month-old WT, p44Tg and p44Tg-p66−/− mice for each group (n = 50). (G) Kaplan–Mayer representation of the lifespan of p44Tg (n = 49) and p44Tg-p66−/− (n = 55) mice (Table S8). Error bars represent SD; significant P-values are indicated (two-tailed t-test).

References

    1. Alderman JM, Flurkey K, Brooks NL, Naik SB, Gutierrez JM, Srinivas U, Ziara KB, Jing L, Boysen G, Bronson R, Klebanov S, Chen X, Swenberg JA, Stridsberg M, Parker CE, Harrison DE, Combs TP. Neuroendocrine inhibition of glucose production and resistance to cancer in dwarf mice. Exp. Gerontol. 2009;44:26–33. - PMC - PubMed
    1. Baker DJ, Jeganathan KB, Cameron JD, Thompson M, Juneja S, Kopecka A, Kumar R, Jenkins RB, de Groen PC, Roche P, van Deursen JM. BubR1 insufficiency causes early onset of aging-associated phenotypes and infertility in mice. Nat. Genet. 2004;36:744–749. - PubMed
    1. Baker DJ, Jeganathan KB, Malureanu L, Perez-Terzic C, Terzic A, van Deursen JM. Early aging-associated phenotypes in Bub3/Rae1 haploinsufficient mice. J. Cell Biol. 2006;172:529–540. - PMC - PubMed
    1. Baker DJ, Wijshake T, Tchkonia T, LeBrasseur NK, Childs BG, van de Sluis B, Kirkland JL, van Deursen JM. Clearance of p16Ink4a-positive senescent cells delays ageing-associated disorders. Nature. 2011;479:232–236. - PMC - PubMed
    1. Bluher M, Kahn BB, Kahn CR. Extended longevity in mice lacking the insulin receptor in adipose tissue. Science. 2003;299:572–574. - PubMed

Publication types

MeSH terms

Substances