Rapid feature-driven changes in the attentional window
- PMID: 23448524
- PMCID: PMC3859374
- DOI: 10.1162/jocn_a_00376
Rapid feature-driven changes in the attentional window
Abstract
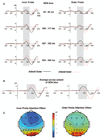
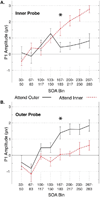
Spatial attention must adjust around an object of interest in a manner that reflects the object's size on the retina as well as the proximity of distracting objects, a process often guided by nonspatial features. This study used ERPs to investigate how quickly the size of this type of "attentional window" can adjust around a fixated target object defined by its color and whether this variety of attention influences the feedforward flow of subsequent information through the visual system. The task involved attending either to a circular region at fixation or to a surrounding annulus region, depending on which region contained an attended color. The region containing the attended color varied randomly from trial to trial, so the spatial distribution of attention had to be adjusted on each trial. We measured the initial sensory ERP response elicited by an irrelevant probe stimulus that appeared in one of the two regions at different times after task display onset. This allowed us to measure the amount of time required to adjust spatial attention on the basis of the location of the task-relevant feature. We found that the probe-elicited sensory response was larger when the probe occurred within the region of the attended dots, and this effect required a delay of approximately 175 msec between the onset of the task display and the onset of the probe. Thus, the window of attention is rapidly adjusted around the point of fixation in a manner that reflects the spatial extent of a task-relevant stimulus, leading to changes in the feedforward flow of subsequent information through the visual system.
Figures


Similar articles
-
Object-based selection of irrelevant features is not confined to the attended object.J Cogn Neurosci. 2011 Sep;23(9):2231-9. doi: 10.1162/jocn.2010.21558. Epub 2010 Jul 28. J Cogn Neurosci. 2011. PMID: 20666592
-
Attention to features precedes attention to locations in visual search: evidence from electromagnetic brain responses in humans.J Neurosci. 2004 Feb 25;24(8):1822-32. doi: 10.1523/JNEUROSCI.3564-03.2004. J Neurosci. 2004. PMID: 14985422 Free PMC article.
-
The time course of encoding and maintenance of task-relevant versus irrelevant object features in working memory.Cortex. 2019 Feb;111:196-209. doi: 10.1016/j.cortex.2018.10.013. Epub 2018 Nov 1. Cortex. 2019. PMID: 30508678 Free PMC article.
-
Irrelevant singletons in visual search do not capture attention but can produce nonspatial filtering costs.J Cogn Neurosci. 2011 Mar;23(3):645-60. doi: 10.1162/jocn.2009.21390. Epub 2009 Nov 23. J Cogn Neurosci. 2011. PMID: 19929330
-
Rapid top-down control over template-guided attention shifts to multiple objects.Neuroimage. 2017 Feb 1;146:843-858. doi: 10.1016/j.neuroimage.2016.08.039. Epub 2016 Aug 21. Neuroimage. 2017. PMID: 27554532
Cited by
-
Interactions between space-based and feature-based attention.J Exp Psychol Hum Percept Perform. 2015 Feb;41(1):11-6. doi: 10.1037/xhp0000011. Epub 2014 Oct 6. J Exp Psychol Hum Percept Perform. 2015. PMID: 25285472 Free PMC article.
-
Altered spatial profile of distraction in people with schizophrenia.J Abnorm Psychol. 2017 Nov;126(8):1077-1086. doi: 10.1037/abn0000314. J Abnorm Psychol. 2017. PMID: 29154568 Free PMC article.
-
Immunity to attentional capture at ignored locations.Atten Percept Psychophys. 2018 Feb;80(2):325-336. doi: 10.3758/s13414-017-1440-4. Atten Percept Psychophys. 2018. PMID: 29116615 Free PMC article.
-
ERPLAB: an open-source toolbox for the analysis of event-related potentials.Front Hum Neurosci. 2014 Apr 14;8:213. doi: 10.3389/fnhum.2014.00213. eCollection 2014. Front Hum Neurosci. 2014. PMID: 24782741 Free PMC article.
-
A Critique of the Attentional Window Account of Capture Failures.J Cogn. 2023 Jul 6;6(1):39. doi: 10.5334/joc.270. eCollection 2023. J Cogn. 2023. PMID: 37426056 Free PMC article.
References
-
- Benjamini Y, Drai D, Elmer G, Kafkafi N, Golani I. Controlling the false discovery rate in behavior genetics research. Behav Brain Res. 2001;125(1–2):279–284. - PubMed
-
- Brainard DH. The psychophysics toolbox. Spatial Vision. 1997;10:433–436. - PubMed
-
- Castiello U, Umilta C. Size of the attentional focus and efficiency of processing. Acta Psychologica. 1990;73:195–209. - PubMed
-
- Delorme A, Makeig S. EEGLAB: an open source toolbox for analysis of single-trial EEG dynamics including independent component analysis. Journal of Neuroscience Methods. 2004;134:9–21. - PubMed
Publication types
MeSH terms
Grants and funding
LinkOut - more resources
Full Text Sources
Other Literature Sources
Molecular Biology Databases

