. 2013 Feb 28;11(1):16.
doi: 10.1186/1478-811X-11-16.

Molecular immunologic correlates of spontaneous latency in a rabbit model of pulmonary tuberculosis

Affiliations

Molecular immunologic correlates of spontaneous latency in a rabbit model of pulmonary tuberculosis

Selvakumar Subbian et al. Cell Commun Signal. .

Abstract

Background: Infection of humans with Mycobacterium tuberculosis (Mtb) results in latent tuberculosis infection (LTBI) in 90-95% of immune competent individuals, with no symptoms of active disease. The World Health Organization estimates that 1.5 billion people have LTBI, which can reactivate in the setting of waning host immunity, posing a threat to global TB control. Various animal models have been used to study the pathogenesis of TB. However, besides nonhuman primates, rabbits are the only animal model that fully recapitulates the pathological features of human TB, including progressive disease with necrosis and cavitation or establishment of spontaneous latency.

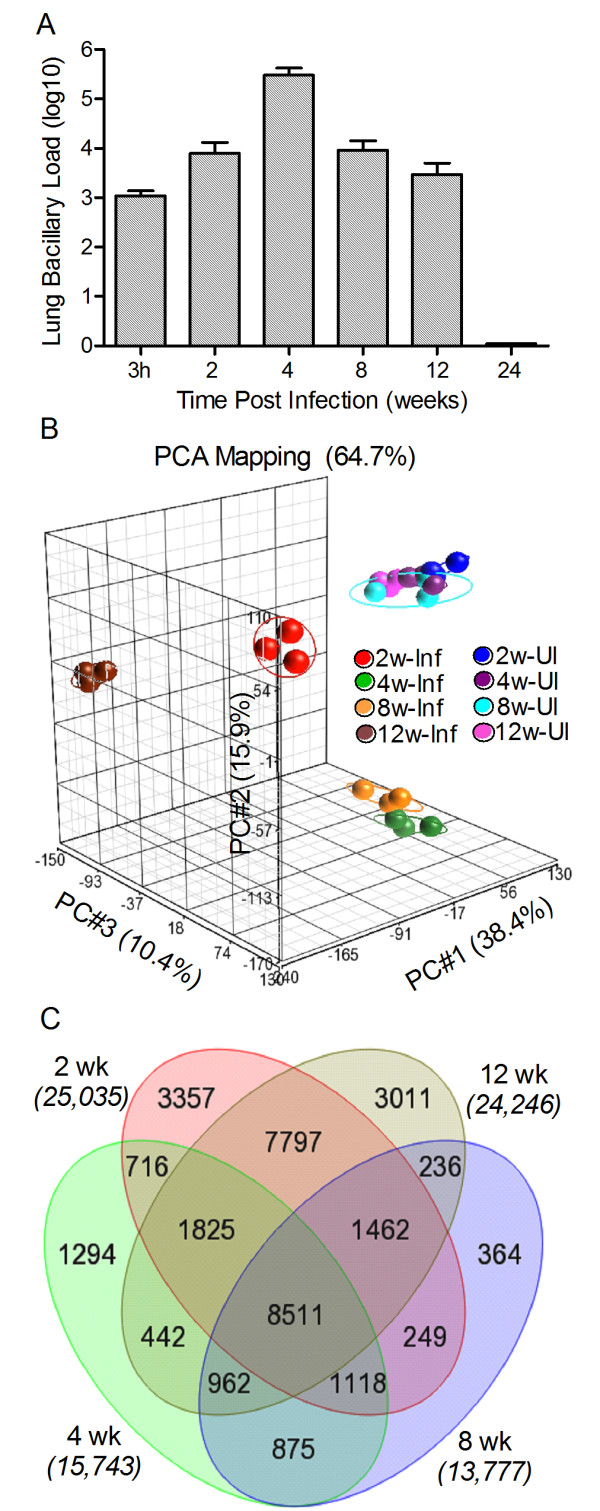
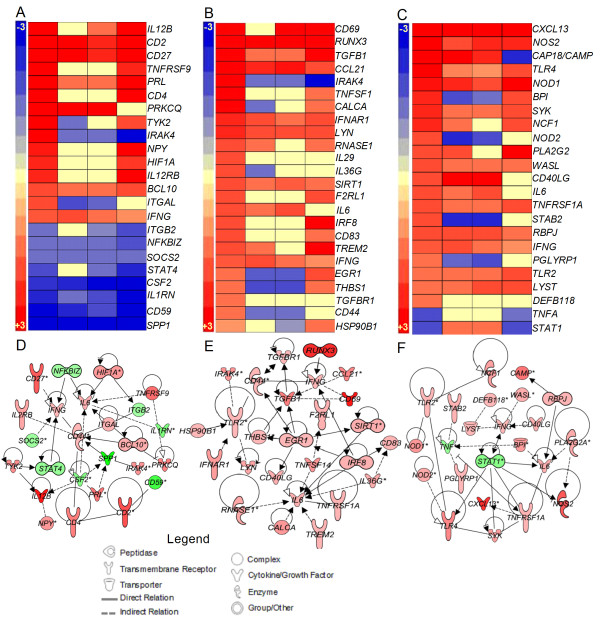
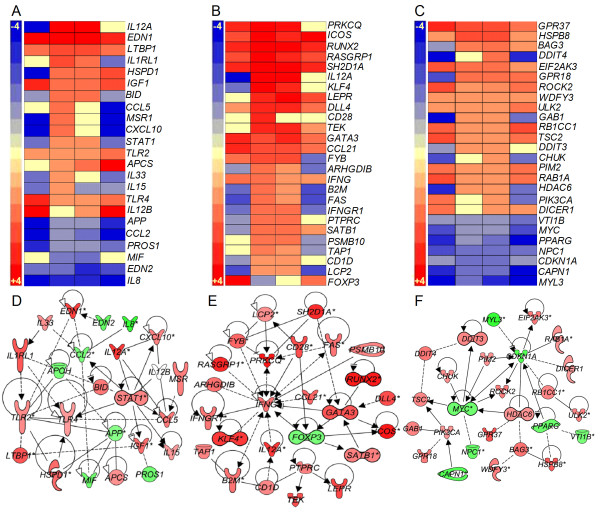
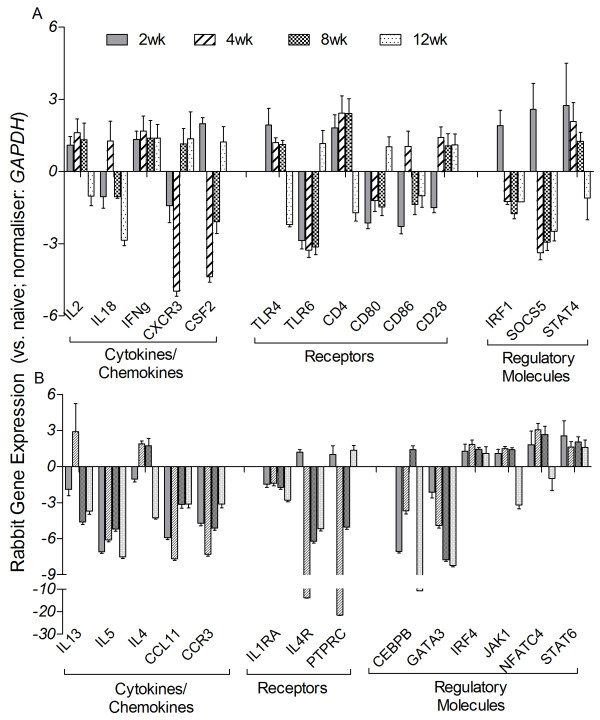
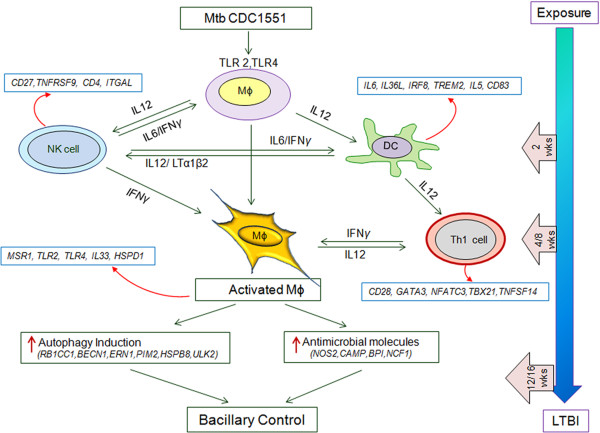
Results: We defined the molecular immunological correlates of LTBI establishment in a rabbit model of pulmonary infection with Mtb CDC1551. After aerosol infection, exponential bacterial growth was noted in the lungs for 4 weeks, followed by a significant decline by 12 weeks, resulting in the absence of cultivable bacilli by 24 weeks. We used rabbit whole genome microarrays to profile the lung transcriptome during the course of infection. At 2 weeks post-infection, gene networks involved in natural killer (NK) and dendritic cell (DC) activation and macrophage antimicrobial activities were highly upregulated. This was followed by upregulation of gene networks involved in macrophage and T cell activation and autophagy, peaking at 4 to 8 weeks. Concomitantly, host Th1, but not Th2 or inflammatory, immune response genes were significantly upregulated. Thus, the expression kinetics of genes involved in cross-talk between innate and adaptive immunity over the first 8 weeks post-infection were consistent with early efficient control of infection in the lungs. Interestingly, expression of many genes of the host innate and adaptive immune response pathways was downregulated at 12 weeks, suggesting that immune activation did not persist once bacilli began to clear from the infected lungs.

Conclusions: Our results suggest that early activation of host innate immunity prior to efficient activation of T cell-mediated adaptive immunity but not inflammation is essential for establishment of LTBI in Mtb CDC1551-infected rabbits. We also show that T cell activation and the host adaptive immune response networks are dampened once bacterial growth is controlled, ultimately resulting in spontaneous LTBI.


Figures

Figure 1
Figure 1
Bacillary growth and global transcriptome analysis of rabbit lungs during Mtb CDC1551 infection. Bacterial CFU in the lungs were enumerated up to 24 weeks and microarray analysis of gene expression profile was performed in the lungs of Mtb-infected rabbits at 2, 4, 8 and 12 weeks post-infection and compared to the uninfected animals. A: Total lung bacillary load determined by plating organ homogenates from each infected rabbit on agar plates. For each animal, about 30% of the entire lung, comprising all 5 lung lobes, was used to prepare the homogenates. B: PCA mapping of data points obtained from pooled samples from uninfected (n = 3) or one experiment from each of the three biological replicates from Mtb-infected rabbit lungs at each time point (n = 3 per time point). Eclipse drawn around the triplicate data points for each time point represents area spanning two-fold standard deviation from the median expression levels. C: Venn diagram showing the number of statistically significantly differentially expressed genes (SDEG) by Mtb infection of rabbit lungs at 2, 4, 8 and 12 weeks post-infection. The genes were selected based on a False Discovery Rate (FDR) of 5% (equivalent to p ≤0.05).
Figure 2
Figure 2
Gene expression analysis of the NK cell activation, DC maturation and host cell antimicrobial defense networks. Intensity plot and network analysis was derived from the SDEG altered by Mtb infection compared to the uninfected reference at 2, 4, 8 and 12 weeks post-infection using Partek Genomics Suite (PGS) and Ingenuity Pathway Analysis (IPA) software. Intensity plot (A) and interaction map (D) of NK cell activation network. Intensity plot (B) and interaction map (E) of DC maturation network. Intensity plot (C) and interaction map (F) of host cell antimicrobial defense network. The scale for all intensity plots ranges from +4 (red) to -4 (blue). Red symbols in the networks indicate up-regulation; green denotes down-regulation of gene expression. For D, E and F, the gradation in the color intensity of gene symbols is proportional to their relative expression level at 2 weeks post-infection.
Figure 3
Figure 3
Gene expression analysis of macrophage and T cell activation and autophagy networks. Intensity plot and gene interaction network analysis was derived from the SDEG at 2, 4, 8 and 12 weeks post-infection using PGS and IPA software. Intensity plot (A) and interaction map (D) of macrophage activation network. Intensity plot (B) and interaction map (E) of T-cell activation network. Intensity plot (C) and interaction map (F) of host cell autophagy induction network. The scales for intensity plots range from +3 (red) to -3 (blue) (A) or +5 to -5 (B) or +4 to -4 (C). Red symbols in networks indicate up-regulation; green denotes down-regulation of gene expression. For D, E and F, the gradation in the color intensity of gene symbols is proportional to their relative expression level at 4 weeks post-infection. The legend for D, E, and F is same as in Figure 2.
Figure 4
Figure 4
qPCR analysis of rabbit genes involved in the Th1 and Th2 type immune response. cDNA was synthesized from the total lung RNA from pooled, uninfected (n = 3) and three independent biological replicates of Mtb-infected rabbits at each time point (2, 4, 8 and 12 weeks post-infection) and used in the qPCR experiments. Genes involved in Th1 (A) and Th2 (B) type immune response were selected from published literature. Gene-specific oligonucleotide primers were used to amplify the test genes. Levels of GAPDH in each sample were used to normalize the expression of test genes. Relative gene expression was calculated from the expression levels of each test gene in the uninfected (naïve) and Mtb-infected samples after normalization against GAPDH levels. The experiments were repeated at least three times with lung total RNA from three biological replicates. Values plotted are median ± standard error.
Figure 5
Figure 5
Schematic representation of control of Mtb CDC1551-infection and establishment of LTBI in rabbit lungs. SDEG in the rabbit lungs at 2, 4, 8 and 12 weeks post-infection was used for modeling. The blue arrow (right) indicates the kinetics of the host protective immune response to infection in the rabbit lungs over time, from exposure to establishment of LTBI. The gene symbols in the boxes next to immune cells were obtained from SDEG in CDC1551-infected rabbit lungs at each time point.

References

    1. WHO. Global tuberculosis control: WHO report 2011. Geneva, Switzerland: World Health Organization; 2011.
    1. Sridhar S, Pollock K, Lalvani A. Redefining latent tuberculosis. Future Microbiol. 2011;6(9):1021–1035. doi: 10.2217/fmb.11.82. - DOI - PubMed
    1. Dye C, Williams BG. The population dynamics and control of tuberculosis. Science. 2010;328(5980):856–861. doi: 10.1126/science.1185449. - DOI - PubMed
    1. Saunders BM, Britton WJ. Life and death in the granuloma: immunopathology of tuberculosis. Immunol Cell Biol. 2007;85(2):103–111. doi: 10.1038/sj.icb.7100027. - DOI - PubMed
    1. Paige C, Bishai WR. Penitentiary or penthouse condo: the tuberculous granuloma from the microbe's point of view. Cell Microbiol. 2010;12(3):301–309. doi: 10.1111/j.1462-5822.2009.01424.x. - DOI - PubMed

LinkOut - more resources