

Quantifying the effects of social influence
- PMID: 23449043
- PMCID: PMC3584930
- DOI: 10.1038/srep01360
Quantifying the effects of social influence
Abstract
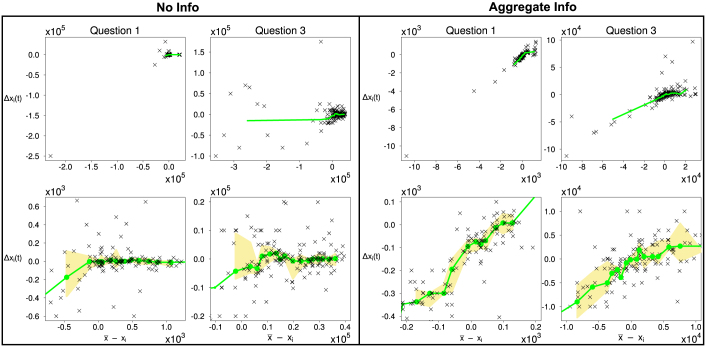
How do humans respond to indirect social influence when making decisions? We analysed an experiment where subjects had to guess the answer to factual questions, having only aggregated information about the answers of others. While the response of humans to aggregated information is a widely observed phenomenon, it has not been investigated quantitatively, in a controlled setting. We found that the adjustment of individual guesses depends linearly on the distance to the mean of all guesses. This is a remarkable, and yet surprisingly simple regularity. It holds across all questions analysed, even though the correct answers differ by several orders of magnitude. Our finding supports the assumption that individual diversity does not affect the response to indirect social influence. We argue that the nature of the response crucially changes with the level of information aggregation. This insight contributes to the empirical foundation of models for collective decisions under social influence.
Figures
Similar articles
-
Integration of Social Information by Human Groups.Top Cogn Sci. 2015 Jul;7(3):469-93. doi: 10.1111/tops.12150. Epub 2015 Jul 17. Top Cogn Sci. 2015. PMID: 26189568 Free PMC article.
-
Is the true 'wisdom of the crowd' to copy successful individuals?Biol Lett. 2012 Apr 23;8(2):197-200. doi: 10.1098/rsbl.2011.0795. Epub 2011 Sep 14. Biol Lett. 2012. PMID: 21920956 Free PMC article.
-
Social influence protects collective decision making from equality bias.J Exp Psychol Hum Percept Perform. 2016 Feb;42(2):164-72. doi: 10.1037/xhp0000145. Epub 2015 Oct 5. J Exp Psychol Hum Percept Perform. 2016. PMID: 26436525
-
Cells, circuits, and choices: social influences on perceptual decision making.Cogn Affect Behav Neurosci. 2008 Dec;8(4):498-508. doi: 10.3758/CABN.8.4.498. Cogn Affect Behav Neurosci. 2008. PMID: 19033244 Review.
-
Decision-making processes: the case of collective movements.Behav Processes. 2010 Jul;84(3):635-47. doi: 10.1016/j.beproc.2010.04.009. Epub 2010 May 8. Behav Processes. 2010. PMID: 20435103 Review.
Cited by
-
Message framing and COVID-19 vaccine acceptance among millennials in South India.PLoS One. 2022 Jul 8;17(7):e0269487. doi: 10.1371/journal.pone.0269487. eCollection 2022. PLoS One. 2022. PMID: 35802760 Free PMC article.
-
The impact of incorrect social information on collective wisdom in human groups.J R Soc Interface. 2020 Sep;17(170):20200496. doi: 10.1098/rsif.2020.0496. Epub 2020 Sep 9. J R Soc Interface. 2020. PMID: 32900307 Free PMC article.
-
Improving Collective Estimations Using Resistance to Social Influence.PLoS Comput Biol. 2015 Nov 13;11(11):e1004594. doi: 10.1371/journal.pcbi.1004594. eCollection 2015 Nov. PLoS Comput Biol. 2015. PMID: 26565619 Free PMC article.
-
Estimating a path through a map of decision making.PLoS One. 2014 Nov 4;9(11):e111022. doi: 10.1371/journal.pone.0111022. eCollection 2014. PLoS One. 2014. PMID: 25369369 Free PMC article.
-
Opinion Formation by Social Influence: From Experiments to Modeling.PLoS One. 2015 Oct 30;10(10):e0140406. doi: 10.1371/journal.pone.0140406. eCollection 2015. PLoS One. 2015. PMID: 26517825 Free PMC article.
References
-
- Kahan D. M. Social influence, social meaning, and deterrence. Virginia Law Review 83, 349–395 (1997).
-
- Mutz D. Impersonal influence: effects of representations of public opinion on political attitudes. Political Behavior 14, 89–122 (1992).
-
- Helbing D., Farkas I. & Vicsek T. Simulating dynamical features of escape panic. Nature 407, 487–90 (2000). - PubMed
-
- Hirshleifer D. & Teoh S. H. Herd behaviour and cascading in capital markets: a review and synthesis. European Financial Management 9, 25–66 (2003).
-
- Salganik M. J., Dodds P. S. & Watts D. J. Experimental study of inequality and unpredictability in an artificial cultural market. Science 311, 854–856 (2006). - PubMed
MeSH terms
LinkOut - more resources
Full Text Sources
Other Literature Sources
