

doi: 10.1007/s10867-011-9252-6.
Epub 2011 Dec 24.
Self-regulation in a minimal model of chemical self-replication
Affiliations
- PMID: 23449095
- PMCID: PMC3326146
- DOI: 10.1007/s10867-011-9252-6
Item in Clipboard
Self-regulation in a minimal model of chemical self-replication
J Biol Phys.
2012 Mar.
Abstract
In biological systems, regulation plays an important role in keeping metabolite concentrations within physiological ranges. To study the dynamical implications of self-regulation, we consider a functional form used in genetic networks and couple it to a mechanism associated with chemical self-replication. For the two-variable minimal model, we find that activation can yield chemical toggles similar to those reported for gene repression in E. coli as well as more complex dynamics.
Keywords: Bistability; Chemical self-replication; Genetic regulation.
Figures
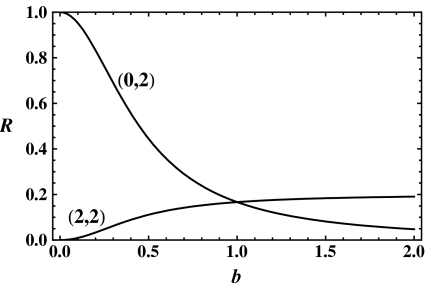
Regulated source, R(b) with r1 = 0, α1 = 0.20, Kr = 0.20, and β = 1 for the pure repression case, (m = 0, n = 2), and the activation with a saturation case (2,2)
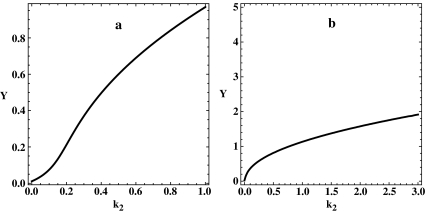
Steady-state solutions for pure repression as a function of k2, with m = 0,n = 2, r = 0.10, ku = 0.01, and β = 1. aK2 = 0.30 and K = 0.10; bK2 = 0.05, and K = 0.20
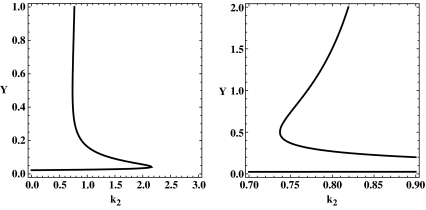
Steady-state solutions for activation with saturation as a function of k2 with m = n = 2, r = 0.10, K2 = 0.05, K = 0.20, ku = 0.01, and β = 1. The figure on the right is an enlargement of the left-hand figure, showing the three-root region of (29)
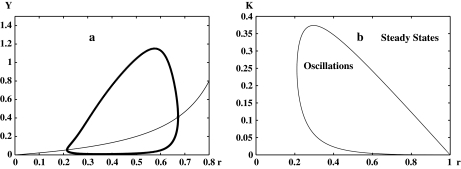
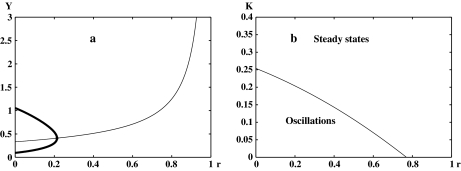
Bifurcation diagrams for k2 = 0 and m = 0, n = 2, K2 = 0.05, ku = 0.01, and β = 1. Thick dark line encloses the region of oscillations, thin dark line shows stable steady states, and thin light line, inside the oscillatory region, shows unstable steady states. a One parameter, r, diagram with K = 0.20, and b Two parameter diagram, (r,K)
Bifurcation diagrams for k2 = 0.10 and m = 0, n = 2, K2 = 0.05, and ku = 0.01. For meaning of the line types, see Fig. 4. a One parameter, r, diagram with K = 0.20, and b two parameter diagram, (r,K)
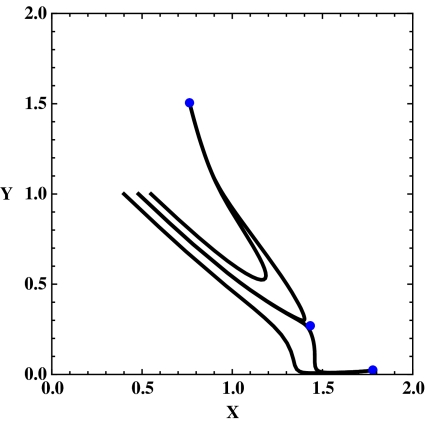
Bistability for m = n = 2, r = 0.10, k2 = 0.80, K2 = 0.05, K = 0.20, ku = 0.01, and β = 1. The blue dots show the three steady states and the black lines show the trajectories of four different initial conditions. Two of the initial conditions are close to the separatrix
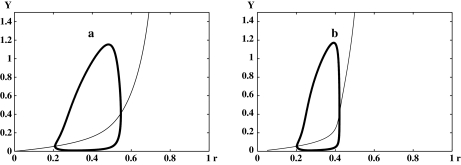
Bifurcation diagram for activation with saturation and leak transcription, where r is the bifurcation parameter with m = n = 2, K2 = 0.10, K = 0.20, ku = 0.01, and β = 1. ak2 = 0.20, and bk2 = 0.40. For interpretation of the lines, see Fig. 4
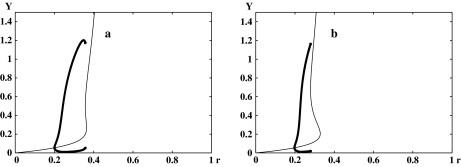
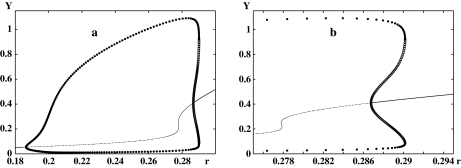
Bifurcation diagram for activation with saturation and leak transcription, where r is the bifurcation parameter with m = n = 2, K2 = 0.10, K = 0.20, ku = 0.01, and β = 1. ak2 = 0.50, and bk2 = 0.60. For interpretation of the lines, see Fig. 4
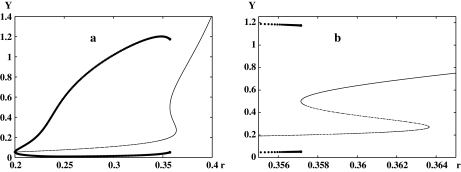
Bifurcation diagram for activation with saturation and leak transcription, where r is the bifurcation parameter. am = n = 2, K2 = 0.10, K = 0.20, β = 1, ku = 0.01, and k2 = 0.50, and b amplification of the figure near the saddle-node. For interpretation of the lines, see Fig. 4
Bifurcation diagram for activation with saturation and leak transcription, where r is the bifurcation parameter. am = n = 2, K2 = 0.05, K = 0.20, β = 1, ku = 0.01, and k2 = 0.50. b Amplification of the figure near the saddle-node. For interpretation of the lines, see Fig. 4. Notice the region of coexistence between stable limit cycles and stable steady states, which could be a source of hysteresis
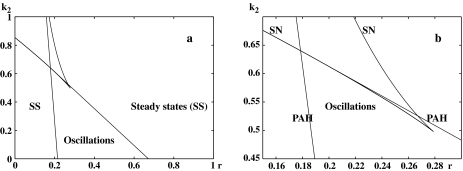
a Two-parameter bifurcation diagram for activation with saturation and leak transcription, where r and k2 are the bifurcation parameters. Other parameters are: m = n = 2, K2 = 0.05, K = 0.20, β = 1, and ku = 0.01. b Amplification of the figure near the saddle node (SN) bifurcations showing the PAH bifurcation
References
-
- Latchman DS. Gene Regulation. 5. New York: Taylor and Francis; 2005.
-
- Ptashne M. A Genetic Switch. Cold Spring Harbor: Cold Spring Harbor Laboratory; 2004.
-
- Ptashne M, Gann A. Genes and Signals. Cold Spring Harbor: Cold Spring Harbor Laboratory; 2002.
-
- Alon U. An Introduction to Systems Biology. Boca Raton: Chapman and Hall; 2007.
-
- Aguda BD, Friedman A. Models of Cellular Regulation. Oxford: Oxford University Press; 2008.
LinkOut - more resources
Full Text Sources
