

Metformin mitigates the impaired development of skeletal muscle in the offspring of obese mice
- PMID: 23449382
- PMCID: PMC3302133
- DOI: 10.1038/nutd.2011.3
Metformin mitigates the impaired development of skeletal muscle in the offspring of obese mice
Abstract
Background: Maternal obesity is linked with offspring obesity and type 2 diabetes. Skeletal muscle (SM) insulin resistance is central to the development of diabetes. Adenosine monophosphate (AMP)-activated protein kinase (AMPK) is inhibited in SM of fetuses born to obese mothers.
Objective: The aim of this study was to evaluate the effect of maternal metformin administration on AMPK activity and reversion of adverse changes in offspring SM of obese mice.
Design: Female weanling C57BL/6J mice received either control diet (CON, 6 mice) or high-fat diet (HFD; OB, 12 mice) for 8 weeks before mating. After mating, mice continued receiving their respective CON or OB diets. In addition, 6 of those 12 mice fed with fat diet also received metformin administration (2 mg per ml in drinking water) throughout gestation and lactation (MET). After weaning at postnatal 21 days, offspring were fed a HFD to mimic a postnatal obesogenic environment until necropsy.
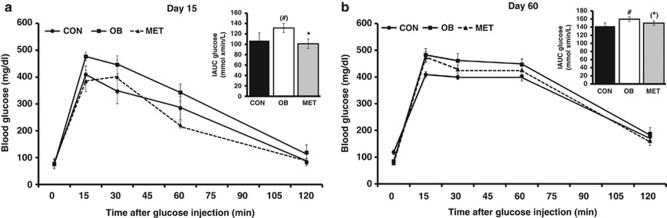
Results: Mothers receiving the fat diet developed obesity. OB offspring showed higher adiposity than CON and MET offspring. AMPK phosphorylation was lower in SM of OB offspring. β-Catenin and myogenic regulatory factors, MyoD and myogenin, were downregulated in OB muscle, whereas the adipogenic marker, peroxisome proliferator-activated receptor-γ, was upregulated compared with CON muscle. Metformin administration prevented these changes in OB offspring SM. OB but not MET offspring demonstrated glucose intolerance. Mitochondrial content decreased, and activities of citrate synthase and β-hydroxyacyl-CoA dehydrogenase also decreased in OB offspring SM, whereas they were recovered in MET offspring SM.
Conclusion: Maternal metformin administration improves SM development in OB offspring.
Figures


Similar articles
-
Sex-specific effects of maternal metformin intervention during glucose-intolerant obese pregnancy on body composition and metabolic health in aged mouse offspring.Diabetologia. 2022 Dec;65(12):2132-2145. doi: 10.1007/s00125-022-05789-0. Epub 2022 Sep 16. Diabetologia. 2022. PMID: 36112170 Free PMC article.
-
Maternal Metformin Treatment during Gestation and Lactation Improves Skeletal Muscle Development in Offspring of Rat Dams Fed High-Fat Diet.Nutrients. 2021 Sep 28;13(10):3417. doi: 10.3390/nu13103417. Nutrients. 2021. PMID: 34684418 Free PMC article.
-
AMP-activated protein kinase signalling pathways are down regulated and skeletal muscle development impaired in fetuses of obese, over-nourished sheep.J Physiol. 2008 May 15;586(10):2651-64. doi: 10.1113/jphysiol.2007.149633. Epub 2008 Mar 27. J Physiol. 2008. PMID: 18372306 Free PMC article.
-
Maternal obesity-impaired insulin signaling in sheep and induced lipid accumulation and fibrosis in skeletal muscle of offspring.Biol Reprod. 2011 Jul;85(1):172-8. doi: 10.1095/biolreprod.110.089649. Epub 2011 Feb 23. Biol Reprod. 2011. PMID: 21349823 Free PMC article.
-
Current biochemical studies of nonalcoholic fatty liver disease and nonalcoholic steatohepatitis suggest a new therapeutic approach.Am J Gastroenterol. 2003 Sep;98(9):2093-7. doi: 10.1111/j.1572-0241.2003.07670.x. Am J Gastroenterol. 2003. PMID: 14499793 Review.
Cited by
-
Metformin from mother to unborn child - Are there unwarranted effects?EBioMedicine. 2018 Sep;35:394-404. doi: 10.1016/j.ebiom.2018.08.047. Epub 2018 Aug 27. EBioMedicine. 2018. PMID: 30166273 Free PMC article. Review.
-
Maternal Inactivity Programs Skeletal Muscle Dysfunction in Offspring Mice by Attenuating Apelin Signaling and Mitochondrial Biogenesis.Cell Rep. 2020 Dec 1;33(9):108461. doi: 10.1016/j.celrep.2020.108461. Cell Rep. 2020. PMID: 33264618 Free PMC article.
-
AMP-activated protein kinase mediates myogenin expression and myogenesis via histone deacetylase 5.Am J Physiol Cell Physiol. 2013 Oct 15;305(8):C887-95. doi: 10.1152/ajpcell.00124.2013. Epub 2013 Aug 7. Am J Physiol Cell Physiol. 2013. PMID: 23926128 Free PMC article.
-
Targeted Multiplex Gene Expression Profiling to Measure High-Fat Diet and Metformin Effects on Fetal Gene Expression in a Mouse Model.Reprod Sci. 2019 May;26(5):683-689. doi: 10.1177/1933719118786453. Epub 2018 Jul 5. Reprod Sci. 2019. PMID: 29976116 Free PMC article.
-
Maternal obesity induces epigenetic modifications to facilitate Zfp423 expression and enhance adipogenic differentiation in fetal mice.Diabetes. 2013 Nov;62(11):3727-35. doi: 10.2337/db13-0433. Epub 2013 Jul 24. Diabetes. 2013. PMID: 23884886 Free PMC article.
References
-
- Galtier F, Raingeard I, Renard E, Boulot P, Bringer J. Optimizing the outcome of pregnancy in obese women: from pregestational to long-term management. Diabetes Metab. 2008;34:19–25. - PubMed
Grants and funding
LinkOut - more resources
Full Text Sources
Miscellaneous
