Review
. 2013 Mar 1;112(5):849-62.
doi: 10.1161/CIRCRESAHA.111.300158.

Rotors and the dynamics of cardiac fibrillation

Affiliations
Review

Rotors and the dynamics of cardiac fibrillation

Sandeep V Pandit et al. Circ Res. .

Abstract

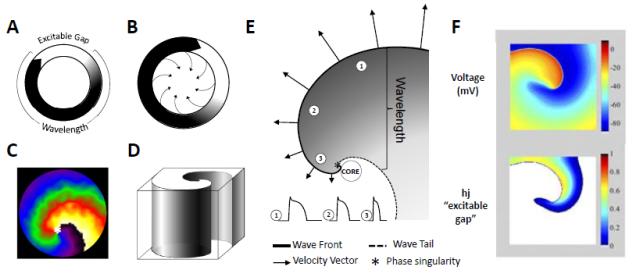
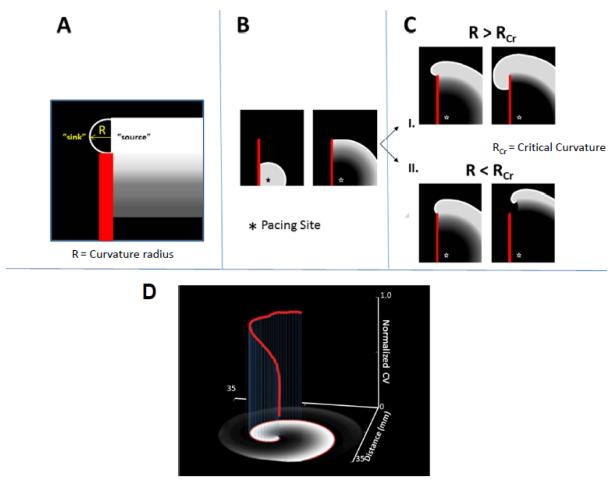
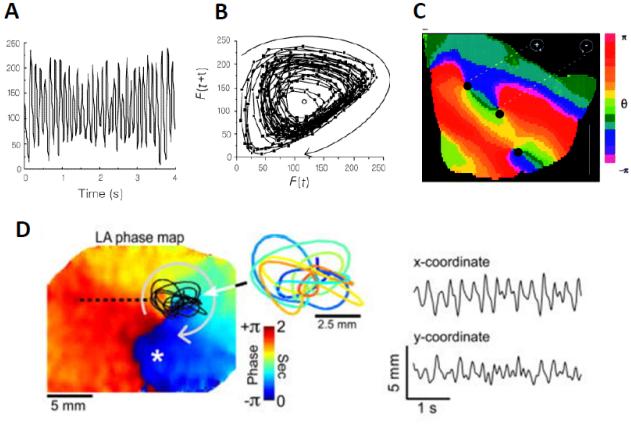
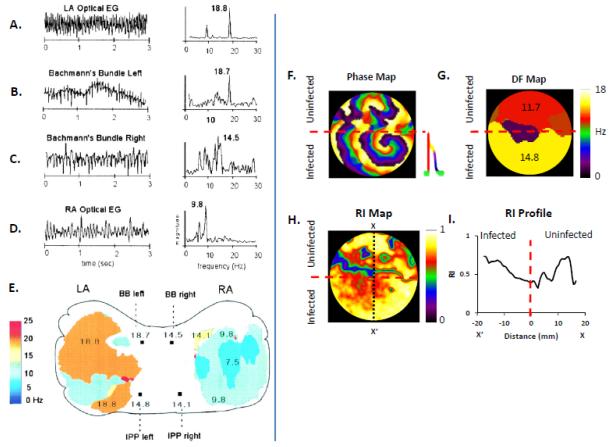
The objective of this article is to present a broad review of the role of cardiac electric rotors and their accompanying spiral waves in the mechanism of cardiac fibrillation. At the outset, we present a brief historical overview regarding reentry and then discuss the basic concepts and terminologies pertaining to rotors and their initiation. Thereafter, the intrinsic properties of rotors and spiral waves, including phase singularities, wavefront curvature, and dominant frequency maps, are discussed. The implications of rotor dynamics for the spatiotemporal organization of fibrillation, independent of the species being studied, are described next. The knowledge gained regarding the role of cardiac structure in the initiation or maintenance of rotors and the ionic bases of spiral waves in the past 2 decades, as well as the significance for drug therapy, is reviewed subsequently. We conclude by examining recent evidence suggesting that rotors are critical in sustaining both atrial and ventricular fibrillation in the human heart and its implications for treatment with radiofrequency ablation.


Figures

Figure 1
Figure 1
Rotors and Spirals, Basic concepts. (A.) Schematic representation of reentry around a ring-like anatomical obstacle where the wavelength (black) is shorter than the path length allowing for a fully excitable gap (white). (B.) Leading circle reentry around a functional obstacle, with centripretal forces pointing inwards toward a refractory center. (C.) Two-dimensional spiral wave, along with the rotor tip at the center “*”. (D.) Schematic of a three-dimensional scroll wave. (E.) Snapshot of the spiral wave: Electrotonic effects of the core decrease conduction velocity (arrows), action potential duration (representative examples shown from positions 1, 2 and 3) and wavelength (the distance from the wave front (black line) to the wave tail (dashed line)). Conduction velocity (CV) decreases and wavefront curvature becomes more pronounced, near the rotor, which is a phase singularity at the point where the wave front and the wave tail meet “*”. (F.) Computer simulation of reentry (From Reference 38:). Top panel: snapshot of the transmembrane voltage distribution during simulated reentry in chronic AF conditions in a 2D sheet incorporating human atrial ionic math models. Bottom panel: snapshot of inactivation variables of sodium current, “h.j” during reentry.
Figure 2
Figure 2
Rotor initiation, vortex shedding. (A.) Schematic of the mechanism of detachment. Definition of the radius of curvature R, of the propagating wavefront (source) as it is about to invade the excitable, but non-excited tissue (sink) (B.) As a wave progresses along an obstacle (red line) the curvature of the wave at the edge of the obstacle will determine if the wave detaches. (C.) If the curvature of the wavefront (R) at the edge of the obstacle is greater than the critical curvature for detachment (RCr) the wave remains attached; if R is less than RCr the wave will detach from the obstacle and initiate reentry. (D.) Three-dimensional plot illustrating the effect the wavefront curvature at progressively shorter distances (x-,y-axis) from the core has on normalized conduction velocity (red, z-axis) in a Luo-Rudy computer simulation of reentry.
Figure 3
Figure 3
From Reference 29) Singularity points revealed by phase plane analysis. (A.) Optical signal in time domain at a given point on the surface of a rabbit ventricle during VF. (B.) Phase plane analysis, where optical signal with embedded delay F(t+τ) is plotted against itself F(t). (C.) Phase movie during VF, with identification of rotors or phase singularities(PS), as dark black dots, at points where all phases (colors) converge. (D.) Rotor meandering and fractionation in optical mapping experiment during AF in isolated sheep heart. On the left, a left atrial phase snapshot demonstrates reentrant activity in the LA free wall. The inset shows the time-space trajectory of the tip; the x and y-coordinate signals are shown on the right. Modified from Zlochiver et al .
Figure 4
Figure 4
Dominant frequency analysis of rotors and fibrillatory conduction. (A.-D.) Time-dependent optical signals and electrograms (left) and corresponding fast Fourier transform (FFT) right) from the left atrium (LA), Bachmann’s Bundle (left), Bachmann’s Bundle (right), and right atrium (RA) during AF induced in the presence of acetylcholine in an isolated, Langendorff-perfused sheep heart. (E.) Dominant Frequency (DF) map of areas within the LA and RA showing a Left-to-Right DF gradient during AF. (A-E: From reference 59) (F.) Phase map of a regionally ad-hERG infected neonatal rat ventricular myocyte monolayer showing a fast stable rotor within the infected region (below red dashed line) and patterns of wavebreak and fibrillatory conduction in the uninfected region (above red dashed line;). (G.) DF map demonstrating a frequency gradient between uninfected and hERG overexpressing regions, with an increased frequency of activation within the infected region. (H.) Regularity Index (RI) map showing a decrease (blue) in the regularity of activation at the hERG and APD gradient region. (I.) RI profile (taken at the black dotted line, along X-X’) further illustrating that the region of greatest wave disruption occurs at the hERG/APD gradient (red dashed line).
Figure 5
Figure 5
Scaling of frequency of rotors anf fibrillation (From Reference 73). (A.) DF maps during VF in mouse, guinea pig, rabbit and humans. (B.) Double-logarithmic plot of DF versus body mass in different species.
Figure 6
Figure 6
Rotors, ionic basis. (A.) Rotors in wild-type (WT) and transgenic (TG) mouse hearts where IK1 was overexpressed. (From Reference 105) (B.) Rotors in a control NRVM monolayer, and a similar monolayer in which IKs was overexpressed via adenovirus. (C.) Rotors in a control NRVM monolayer, and a similar monolayer where IKr was overexpressed via adenovirus. (From reference 108).
Figure 7
Figure 7
Rotors and antiarrhythmic drugs in VF and AF. (A.) DF maps of VF in IK1 overexpressing TG mice, in the absence and presence of chloroquine. (From Reference 121) (B.) Comparison of quinidine versus chloroquine effects on normalized DF in VF. (From Reference 121) (C.) DF maps and underlying optical/electrical signals during stretch-induced AF in isolated sheep hearts, in control, and in the presence of chloroquine. (From Reference 122) (D.) Comparison of the effects of flecainide and chloroquine on the DF during stretch-induced AF in sheep hearts. (From Reference 122)
Figure 8
Figure 8
Rotors in human hearts. (A.) Sequential snapshots during a full rotation of a rotor located near the lateral wall of the left ventricle and generating VF in a human heart mapped optically, in vitro. (From Reference 72). (B.) Left atrial rotor and fibrillatory conduction during AF in a human heart mapped electrically in-vivo using two transvenous basket catheters simultaneously (modified from Reference 129 with permission of the authors and the publisher).

References

    1. Jalife J. Déjà vu in the theories of atrial fibrillation dynamics. Cardiovasc Res. 2011 Mar 1;89(4):766–75. Epub 2010 Nov 19. Review. - PMC - PubMed
    1. Mayer A. Rhythmical Pulsation in Scyphomedusae. Carnegie Institute of Washington; Washington, DC: 1906. pp. 1–62. Publication number 47.
    1. Mines GR. On dynamic equilibrium in the heart. J Physiol. 1913;46:349–383. - PMC - PubMed
    1. Mines G. On circulating excitations in heart muscles and their possible relation to tachycardia and fibrillation. Trans R Soc Can. 1914;4:43–52.
    1. Garrey W. The nature of fibrillary contraction of the heart: its relation to tissue mass and form. Am J Physiol. 1914;33:397–414.

Publication types

MeSH terms