Review
. 2013 Mar 1;112(5):863-74.
doi: 10.1161/CIRCRESAHA.112.279315.

Noninvasive electrocardiographic imaging of arrhythmogenic substrates in humans

Affiliations
Review

Noninvasive electrocardiographic imaging of arrhythmogenic substrates in humans

Yoram Rudy. Circ Res. .

Abstract

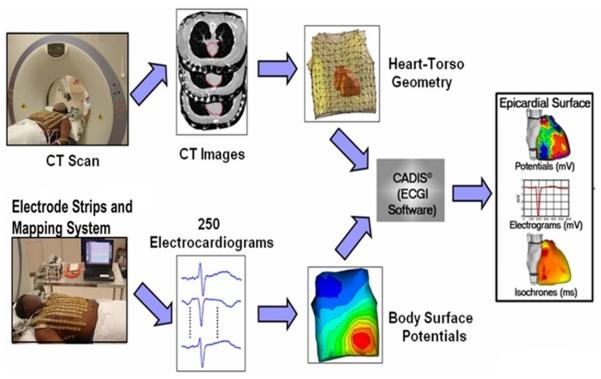
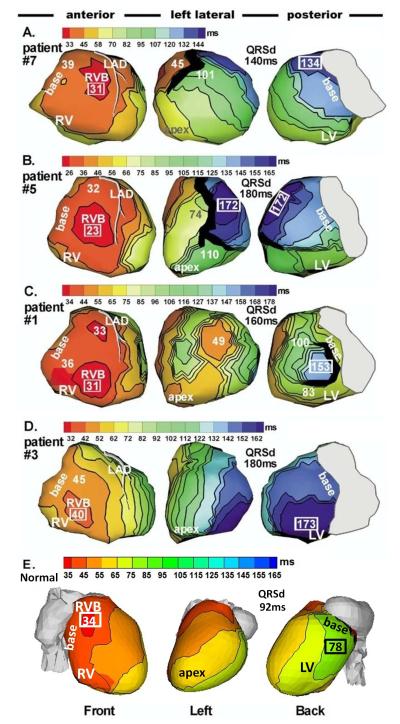
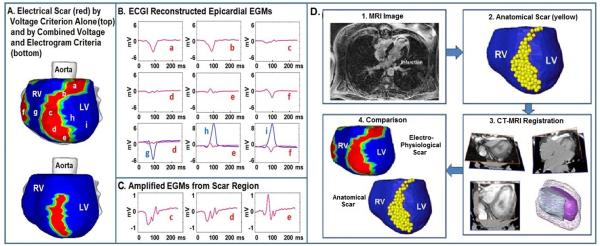
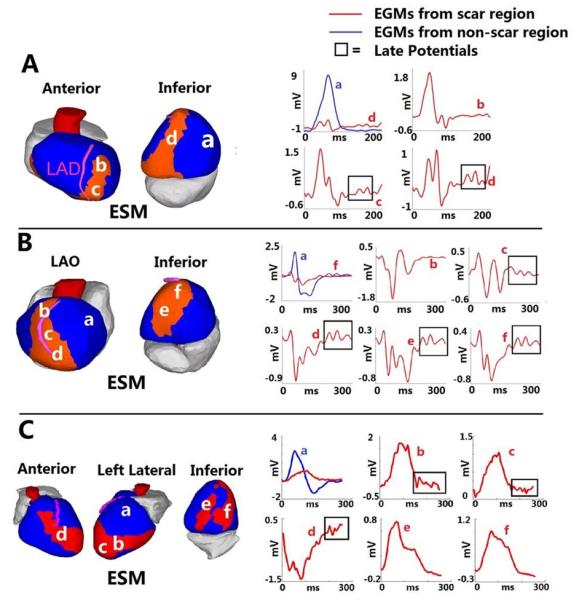
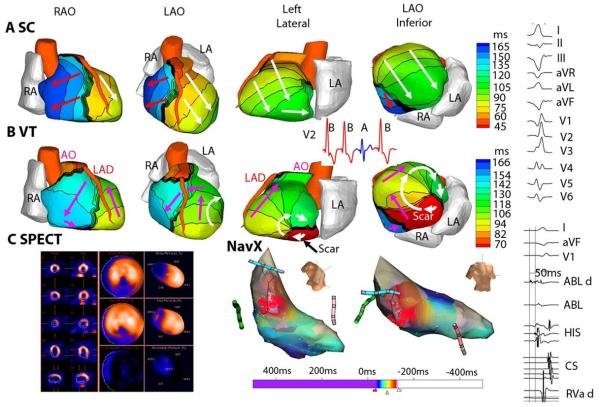
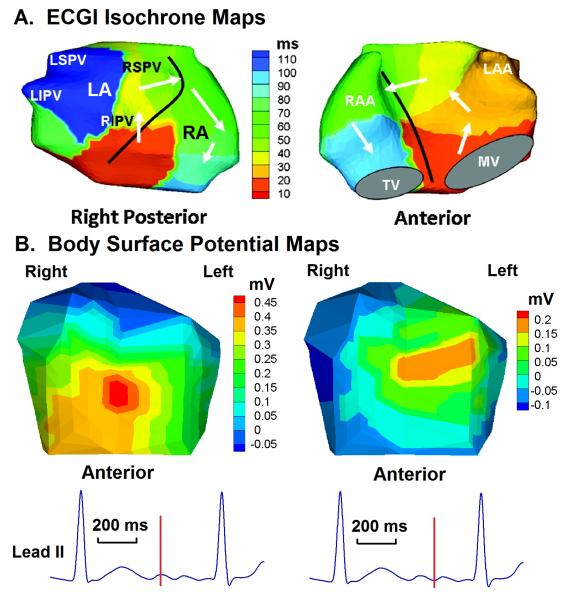
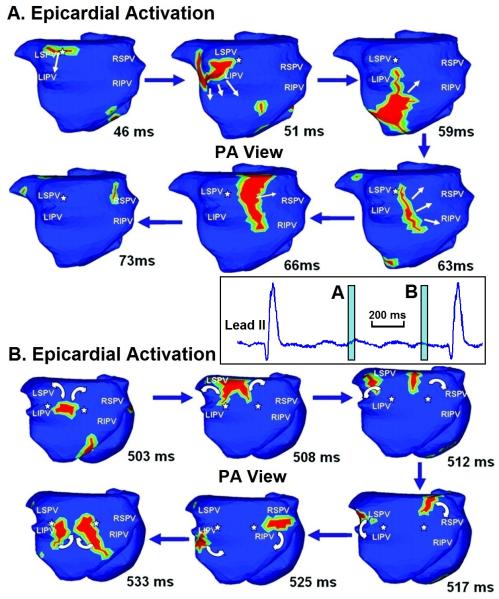
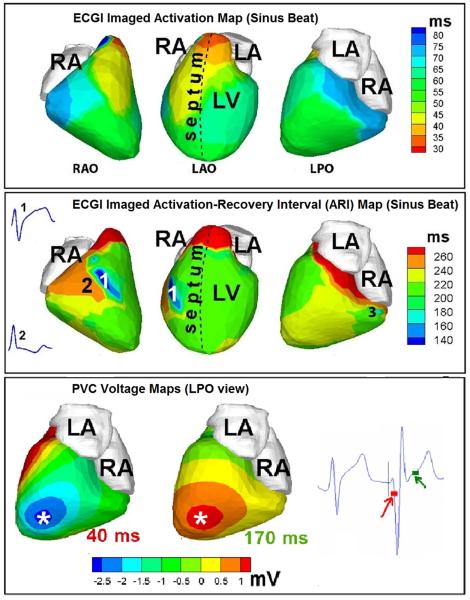
Cardiac excitation is determined by interactions between the source of electric activation (membrane depolarization) and the load that cardiac tissue presents. This relationship is altered in pathology by remodeling processes that often create a substrate favoring the development of cardiac arrhythmias. Most studies of arrhythmia mechanisms and arrhythmogenic substrates have been conducted in animal models, which may differ in important ways from the human pathologies they are designed to represent. Electrocardiographic imaging is a noninvasive method for mapping the electric activity of the heart in humans in real-world conditions. This review summarizes results from electrocardiographic imaging studies of arrhythmogenic substrates associated with human clinical arrhythmias. Examples include heart failure, myocardial infarction scar, atrial fibrillation, and abnormal ventricular repolarization.


Figures

Figure 1
Figure 1
The ECGI procedure. Bottom: The electrical data. 250 electrocardiograms over the entire torso surface are recorded simultaneously to generate body surface potential maps every millisecond. Top: The geometrical data. CT scan provides the epicardial geometry and body-surface electrode positions in the same image. The electrical and geometrical data are combined and processed by the ECGI algorithms to reconstruct potentials, electrograms, activation isochrones and repolarization patterns on the surface of the heart. (Adapted from reference 4).
Figure 2
Figure 2
Epicardial isochrone maps of native rhythm in four representative HF patients (A to D) and in a normal heart (E). Three views are shown for each heart, as indicated at the bottom. Thick black markings indicate conduction block. All HF maps show sequential activation of right ventricle (RV) followed by greatly delayed left ventricular (LV) activation (left bundle branch block, LBBB pattern). RV activation is similar in all patients and has a normal pattern with clearly identified anterior epicardial breakthrough (RVB) location. Details of LV activation vary among patients: A. Apical to lateral-basal conduction. B. Inferior to anterolateral conduction. C. Combined activation from apical, inferior and superior LV. D. Anterior to inferoposterior conduction. Note the variation of region of latest LV activation among the four HF hearts. E. Normal sinus rhythm. Note high degree of ventricular synchrony and absence of conduction delays or block. Numbers indicate activation times (from QRS onset) in milliseconds. QRSd = QRS duration (Adapted from reference , with permission).
Figure 3
Figure 3
Images of post-MI electrical and anatomical scar. A. Electrical scar is shown in red (left anterior oblique view). Top image is based on low voltage electrograms only. Bottom image includes the electrograms fractionation criterion. B. Representative electrograms from the scar (a-f, red) and outside the scar (g, h, i; blue). All scar electrograms are of low magnitude; electrograms c, d, and e are also fractionated, as can be easily appreciated from the expanded scale of panel C. Bottom row of panel B shows scar (red) and non-scar (blue) electrograms on the same scale to demonstrate the magnitude difference. D. Low voltage electrical scar (red) is compared to MRI-imaged anatomical scar (yellow). EGM = epicardial electrogram. From reference with permission.
Figure 4
Figure 4
Late potentials in a post-MI scar. Three examples are shown: A. Inferoseptal scar. B. Anteroapical scar. C. Complex anterior, apical and inferior infarction. Scar maps are presented on the left and selected electrograms on the right. Electrogram locations are indicated with letters. Late potentials (delayed deflections on the electrogram) are highlighted by frame. ESM = electrical scar map. LAO = left anterior oblique. From reference with permission.
Figure 5
Figure 5
Scar-related reentrant VT. The scar is inferobasal. A. Epicardial activation isochrones for a sinus capture (SC) beat. B. The activation pattern during VT beat. A clockwise reentry loop (white arrows in left lateral and LAO inferior views) is anchored to the scar. Pink arrows depict a wavefront propagating in a clockwise fashion into the RV. ECG lead V2 (inset) shows two VT beats (red, B) interrupted by a SC beat (blue, A) followed by another VT beat (VT is monomorphic). Online Movie I shows this entire sequence as imaged by ECGI. C. (left) single-photon emission computed tomography (SPECT) of inferobasal scar (blue). (Right) Endocardial activation during VT mapped with a NavX catheter (red is early; blue is late). Right column presents (top): Twelve lead body-surface ECG of VT; (bottom): signals recorded by the ablation catheter. LAO = left anterior oblique. RAO = right anterior oblique. See Online Movie I. From reference with permission.
Figure 6
Figure 6
Paroxysmal atrial fibrillation. A. A single bi-atrial spiral wave (rotor) drives the arrhythmia (white arrows). 100 ms of AF are depicted in the map (right posterior and anterior views). Black line marks the inter-atrial septum. B. Body surface potential maps at the two instances during AF marked on the ECG lead II at the bottom. Note the low voltages and simple (single-maximum) potential distribution, a consequence of the smoothing effect of the torso volume conductor. LSPV = left superior pulmonary vein. LIPV = left inferior pulmonary vein. RSPV = right superior pulmonary vein. RIPV = right inferior pulmonary vein. RA = right atrium. RAA = right atrial appendage. LA = left atrium. LAA = left atrial appendage. TV = tricuspid valve. MV = mitral valve. Online Movie II shows this repetitive pattern. Adapted from reference with permission.
Figure 7
Figure 7
Long-standing persistent atrial fibrillation. Time-lapse presentation of activation wavelets (red) during AF, shown in posterior-anterior (PA) view. (A) 46-73 ms. (B) 503-533 ms. White arrows indicate direction of wavelet propagation. White asterisks mark pivot points for wavelet rotation. The lead II inset between the panels shows the time windows (light blue) covered by the time-lapse frames in panels A and B. See Online Movie III. Adapted from reference with permission.
Figure 8
Figure 8
Abnormal repolarization substrate in early repolarization syndrome. Top row: Activation isochrone maps during a sinus beat shown in three views (from left to right: right anterior oblique, left anterior oblique, left posterior oblique). Middle row: Repolarization ARI maps for the same sinus beat. Insets show two representative electrograms: (1) from the dark blue area with unusually short ARI, and (2) from an adjacent area. Bottom row: ECGI epicardial potential maps during early activation (40 ms, left) and at the start of repolarization (170 ms, right) of a PVC beat. The time points of the potential maps are shown on an ECG trace to the right of the maps. PVC = premature ventricular complex. Adapted from reference with permission.

References

    1. Rudy Y. Mathematical modeling of complex biological systems: from genes and molecules to organs and organisms: heart. Simulation and Modeling. In: Weinstein H, Egelman EH, editors. Comprehensive Biophysics. Vol. 9. Academic Press; Oxford: 2012. pp. 268–327.
    1. Ursell PC, Gardner PI, Albana A, Fenoglio JJ, Jr, Wit AL. Structural and electrophysiological changes in epicardial border zone of canine myocardial infarcts during healing. Circ Res. 1985;56:436–451. - PubMed
    1. Wit AL, Janse MJ. Experimental models of ventricular tachycardia and fibrillation caused by ischemia and infarction. Circulation. 1992;85:132–42. - PubMed
    1. Ramanathan C, Ghanem RN, Jia P, Ryu K, Rudy Y. Noninvasive electrocardiographic imaging for cardiac electrophysiology and arrhythmia. Nat Med. 2004;10:422–428. - PMC - PubMed
    1. Ramanathan C, Jia P, Ghanem RN, Ryu K, Rudy Y. Activation and repolarization of the normal human heart under complete physiological conditions. Proc Natl Acad Sci U S A. 2006;103:6309–14. - PMC - PubMed

Publication types

MeSH terms