Genome-wide association and longitudinal analyses reveal genetic loci linking pubertal height growth, pubertal timing and childhood adiposity
- PMID: 23449627
- PMCID: PMC3674797
- DOI: 10.1093/hmg/ddt104
Genome-wide association and longitudinal analyses reveal genetic loci linking pubertal height growth, pubertal timing and childhood adiposity
Abstract
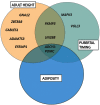
The pubertal height growth spurt is a distinctive feature of childhood growth reflecting both the central onset of puberty and local growth factors. Although little is known about the underlying genetics, growth variability during puberty correlates with adult risks for hormone-dependent cancer and adverse cardiometabolic health. The only gene so far associated with pubertal height growth, LIN28B, pleiotropically influences childhood growth, puberty and cancer progression, pointing to shared underlying mechanisms. To discover genetic loci influencing pubertal height and growth and to place them in context of overall growth and maturation, we performed genome-wide association meta-analyses in 18 737 European samples utilizing longitudinally collected height measurements. We found significant associations (P < 1.67 × 10(-8)) at 10 loci, including LIN28B. Five loci associated with pubertal timing, all impacting multiple aspects of growth. In particular, a novel variant correlated with expression of MAPK3, and associated both with increased prepubertal growth and earlier menarche. Another variant near ADCY3-POMC associated with increased body mass index, reduced pubertal growth and earlier puberty. Whereas epidemiological correlations suggest that early puberty marks a pathway from rapid prepubertal growth to reduced final height and adult obesity, our study shows that individual loci associating with pubertal growth have variable longitudinal growth patterns that may differ from epidemiological observations. Overall, this study uncovers part of the complex genetic architecture linking pubertal height growth, the timing of puberty and childhood obesity and provides new information to pinpoint processes linking these traits.
Figures


References
Publication types
MeSH terms
Substances
Grants and funding
- 076467/WT_/Wellcome Trust/United Kingdom
- R01 MH063706/MH/NIMH NIH HHS/United States
- K05 AA017688/AA/NIAAA NIH HHS/United States
- MOP-82893/CAPMC/ CIHR/Canada
- R01 HL087679/HL/NHLBI NIH HHS/United States
- 068545/Z/02/WT_/Wellcome Trust/United Kingdom
- 092731/WT_/Wellcome Trust/United Kingdom
- 5R01MH63706:02/MH/NIMH NIH HHS/United States
- AA-09203/AA/NIAAA NIH HHS/United States
- R01 AA009203/AA/NIAAA NIH HHS/United States
- R01 AG041517/AG/NIA NIH HHS/United States
- U01 DK062418/DK/NIDDK NIH HHS/United States
- MC_PC_15018/MRC_/Medical Research Council/United Kingdom
- AA-12502/AA/NIAAA NIH HHS/United States
- MC_UU_12011/1/MRC_/Medical Research Council/United Kingdom
- WT083431MA/WT_/Wellcome Trust/United Kingdom
- RD1634/MRC_/Medical Research Council/United Kingdom
- RC2 MH089995/MH/NIMH NIH HHS/United States
- MC_UU_12013/3/MRC_/Medical Research Council/United Kingdom
- BHF_/British Heart Foundation/United Kingdom
- 084762MA/WT_/Wellcome Trust/United Kingdom
- 1RL1MH083268-01/MH/NIMH NIH HHS/United States
- MC_UP_A620_1014/MRC_/Medical Research Council/United Kingdom
- 230374/ERC_/European Research Council/International
- R01 HD056465/HD/NICHD NIH HHS/United States
- MC_UP_A620_1017/MRC_/Medical Research Council/United Kingdom
- MC_PC_U127592696/MRC_/Medical Research Council/United Kingdom
- 090532/WT_/Wellcome Trust/United Kingdom
- MC_UU_12013/4/MRC_/Medical Research Council/United Kingdom
- R01 AA012502/AA/NIAAA NIH HHS/United States
- G0000934/MRC_/Medical Research Council/United Kingdom
- G0500539/MRC_/Medical Research Council/United Kingdom
- 74882/MRC_/Medical Research Council/United Kingdom
- 5R01HL087679-02/HL/NHLBI NIH HHS/United States
- AA-08315/AA/NIAAA NIH HHS/United States
- RL1 MH083268/MH/NIMH NIH HHS/United States
- U01 HG004423/HG/NHGRI NIH HHS/United States
- MC_U127592696/MRC_/Medical Research Council/United Kingdom
- MC_UU_12011/4/MRC_/Medical Research Council/United Kingdom
- G0601653/MRC_/Medical Research Council/United Kingdom
- G9815508/MRC_/Medical Research Council/United Kingdom
- G0600705/MRC_/Medical Research Council/United Kingdom
- R37 AA012502/AA/NIAAA NIH HHS/United States
- U01 HG006830/HG/NHGRI NIH HHS/United States
LinkOut - more resources
Full Text Sources
Other Literature Sources
Medical
Miscellaneous

