. 2013 May;87(9):5219-28.
doi: 10.1128/JVI.02643-12. Epub 2013 Feb 28.

Porcine reproductive and respiratory syndrome virus Nsp1β inhibits interferon-activated JAK/STAT signal transduction by inducing karyopherin-α1 degradation

Affiliations

Porcine reproductive and respiratory syndrome virus Nsp1β inhibits interferon-activated JAK/STAT signal transduction by inducing karyopherin-α1 degradation

Rong Wang et al. J Virol. 2013 May.

Abstract

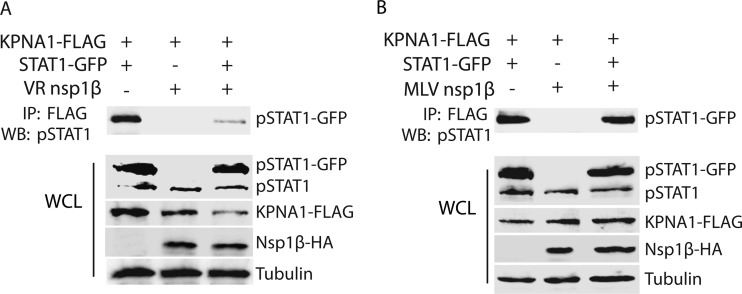
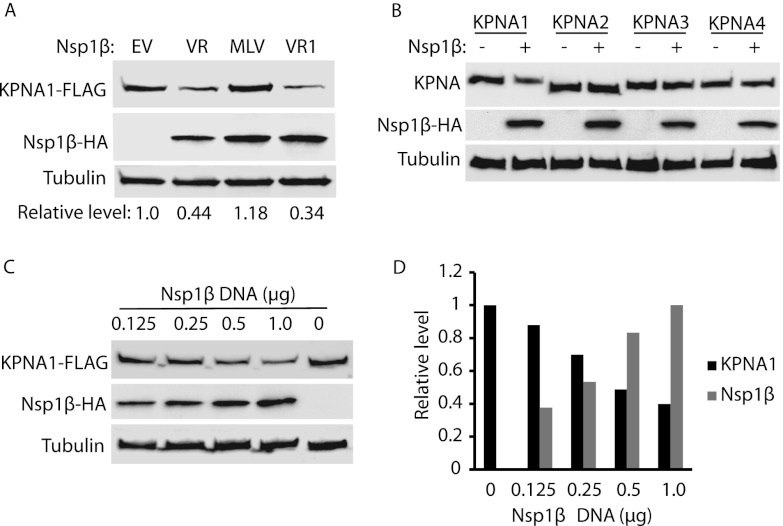
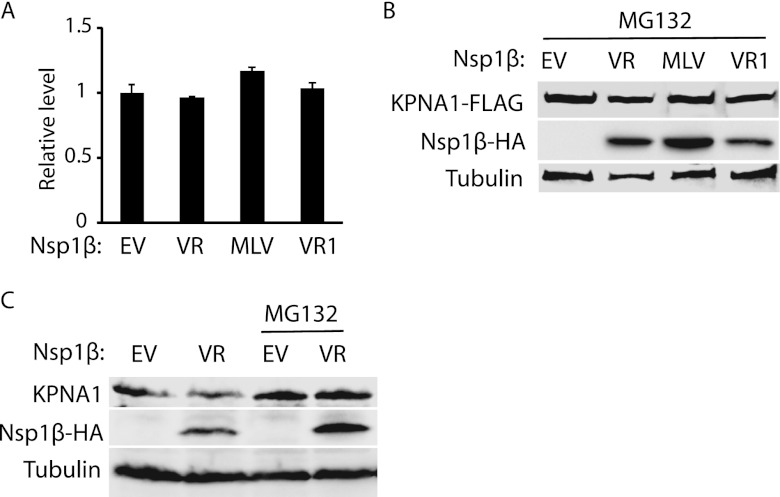
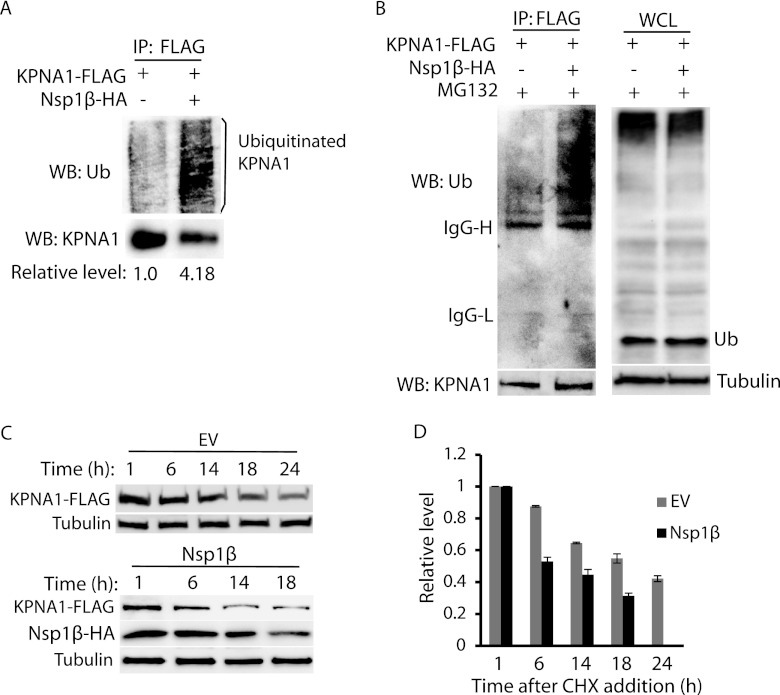
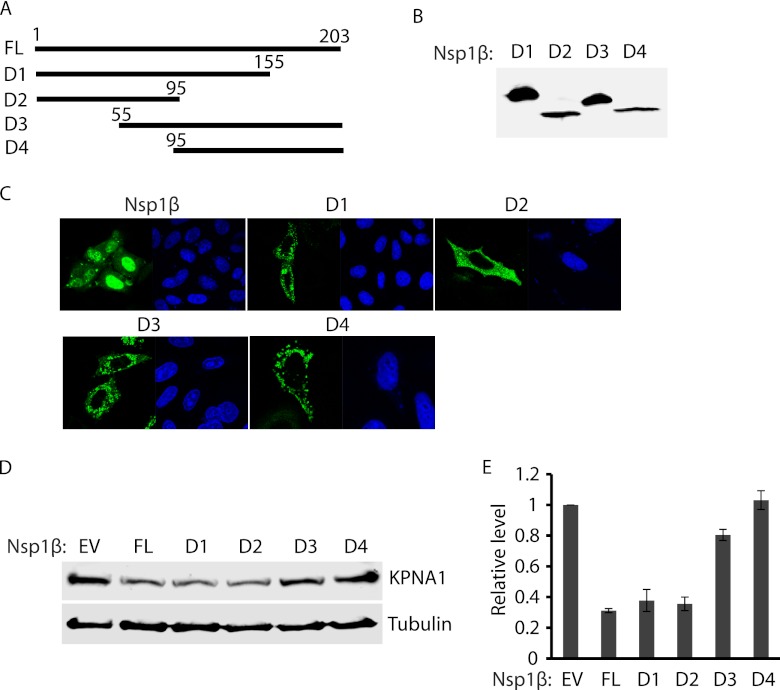
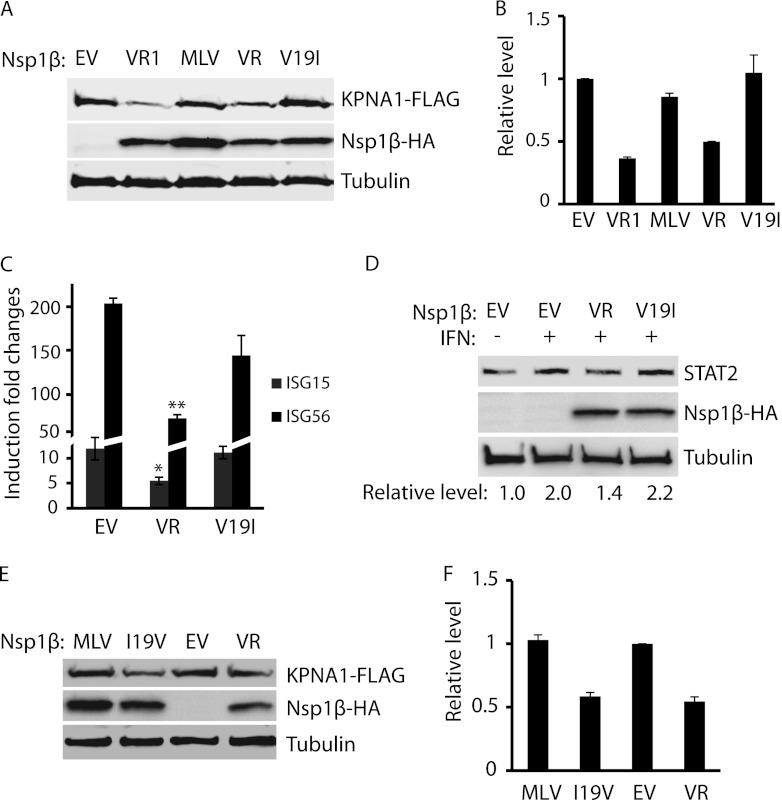
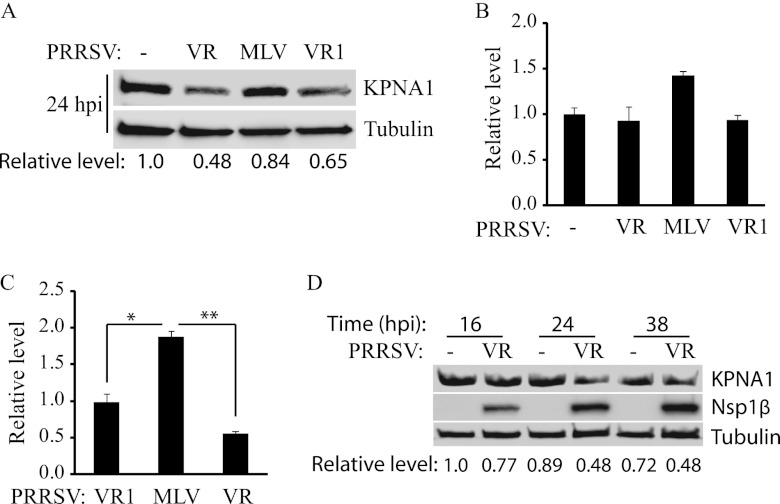
Porcine reproductive and respiratory syndrome virus (PRRSV) inhibits the interferon-mediated antiviral response. Type I interferons (IFNs) induce the expression of IFN-stimulated genes by activating phosphorylation of both signal transducer and activator of transcription 1 (STAT1) and STAT2, which form heterotrimers (interferon-stimulated gene factor 3 [ISGF3]) with interferon regulatory factor 9 (IRF9) and translocate to the nucleus. PRRSV Nsp1β blocks the nuclear translocation of the ISGF3 complex by an unknown mechanism. In this study, we discovered that Nsp1β induced the degradation of karyopherin-α1 (KPNA1, also called importin-α5), which is known to mediate the nuclear import of ISGF3. Overexpression of Nsp1β resulted in a reduction of KPNA1 levels in a dose-dependent manner, and treatment of the cells with the proteasome inhibitor MG132 restored KPNA1 levels. Furthermore, the presence of Nsp1β induced an elevation of KPNA1 ubiquitination and a shortening of its half-life. Our analysis of Nsp1β deletion constructs showed that the N-terminal domain of Nsp1β was involved in the ubiquitin-proteasomal degradation of KPNA1. A nucleotide substitution resulting in an amino acid change from valine to isoleucine at residue 19 of Nsp1β diminished its ability to induce KPNA1 degradation and to inhibit IFN-mediated signaling. Interestingly, infection of MARC-145 cells by PRRSV strains VR-2332 and VR-2385 also resulted in KPNA1 reduction, whereas infection by an avirulent strain, Ingelvac PRRS modified live virus (MLV), did not. MLV Nsp1β had no effect on KPNA1; however, a mutant with an amino acid change at residue 19 from isoleucine to valine induced KPNA1 degradation. These results indicate that Nsp1β blocks ISGF3 nuclear translocation by inducing KPNA1 degradation and that valine-19 in Nsp1β correlates with the inhibition.


Figures

Fig 1
Fig 1
PRRSV strain VR-2385 Nsp1β reduces the complexes of phosphorylated STAT1 interacting with karyopherin-α1 (KPNA1). HEK293 cells were transfected with plasmids expressing KPNA1-FLAG, STAT1-GFP, and Nsp1β-HA. At 48 h posttransfection, the cells were treated with IFN-α for 1.25 h before being lysed for further analysis. (A) VR-2385 Nsp1β reduces complexes of phosphorylated STAT1 and KPNA1. Immunoprecipitation (IP) was done with FLAG antibody, and Western blotting was performed with antibody against phosphorylated STAT1 at tyrosine-701 (pSTAT1). (Bottom) Western blotting results for whole-cell lysate (WCL) using antibodies against pSTAT1, FLAG, HA, and tubulin. (B) Ingelvac PRRS modified live virus (MLV) Nsp1β has minimal effect on the interaction of pSTAT1 and KPNA1. IP was done with FLAG antibody, and Western blotting was conducted with antibody against pSTAT1. (Bottom) Western blotting results for WCL of HEK293 cells with MLV Nsp1β expression using antibodies against pSTAT1, FLAG, HA, and tubulin.
Fig 2
Fig 2
Nsp1β reduces KPNA1 expression. (A) KPNA1 levels are reduced in HEK293 cells with expression of Nsp1βs of VR-2385 and VR-2332. The cells were transfected with plasmids of KPNA1-FLAG and Nsp1β-HA. At 48 h after transfection, the cells were harvested for Western blotting (WB) with antibodies against FLAG, HA, and tubulin. Fold changes of KPNA1 levels are shown below the images. EV, empty vector; VR, VR-2385; VR1, VR-2332. (B) Nsp1β has minimal effect on KPNA2, KPNA3, and KPNA4. HEK293 cells were cotransfected with VR-2385 Nsp1β-HA and KPNA1-FLAG, KPNA2-FLAG, KPNA3-FLAG, or KPNA4-FLAG plasmid. Western blotting was done with antibodies against FLAG, HA, and tubulin. (C) Dose-dependent reduction of KPNA1 by VR-2385 Nsp1β. HEK293 cells were transfected with KPNA1-FLAG and incremental amounts of Nsp1β-HA plasmid. At 48 h after transfection, the cells were harvested for Western blotting. (D) Densitometry analysis of experimental results shown in panel C to show relative KPNA1 and Nsp1β levels after normalization with tubulin. Fold changes of KPNA1 and Nsp1β levels in comparison with the results for empty vector and 1-μg Nsp1β, respectively, were calculated. The incremental amounts of Nsp1β-HA plasmid DNA are shown on the x axis.
Fig 3
Fig 3
Nsp1β reduces KPNA1 expression via the proteasome pathway. (A) KPNA1 mRNA level is not affected by Nsp1β expression. HEK293 cells were transfected with VR-2385 Nsp1β plasmid. At 24 h after transfection, the cells were harvested for RNA isolation and RT-qPCR. Error bars represent standard deviations of the results of three repeated experiments. EV, empty vector; VR, VR-2385; VR1, VR-2332. (B) The Nsp1β-induced KPNA1 reduction is inhibited by MG132 treatment. HEK293 cells were cotransfected with Nsp1β-HA and KPNA1-FLAG plasmids. At 48 h after transfection, the cells were treated with MG132 and harvested for Western blotting with antibodies against FLAG, HA, and tubulin. (C) VR-2385 Nsp1β reduces endogenous KPNA1 level, while MG132 treatment diminishes the inhibition. HEK293 cells were transfected with Nsp1β-HA plasmid. Western blotting was done with antibodies against KPNA1, HA, and tubulin.
Fig 4
Fig 4
VR-2385 Nsp1β increases KPNA1 ubiquitination. (A) KPNA1 ubiquitination in HEK293 cells with Nsp1β expression is higher than that in cells with empty vector. The cells cotransfected with KPNA1-FLAG, VR-2385 Nsp1β-HA, and ubiquitin-Myc plasmids were lysed for IP. Western blotting with ubiquitin antibody (WB: Ub) was done after IP. Fold changes of ubiquitin levels in comparison with the results for the cells without Nsp1β after normalization with the KPNA1 level are shown below the images. (B) Nsp1β expression leads to elevation of KPNA1 ubiquitination, while ubiquitination levels of total proteins in whole-cell lysate (WCL) of HEK293 cells in the presence or absence of Nsp1β are similar. HEK293 cells were cotransfected with KPNA1-FLAG, VR-2385 Nsp1β-HA, and ubiquitin-Myc plasmids and treated with MG132. (Left) Western blotting of IP samples with antibodies against ubiquitin and FLAG. The bands of immunoglobulin G heavy chain (IgG-H) and light chain (IgG-L) from IP elusion are indicated on the left. (Right) Western blotting of WCL with antibodies against ubiquitin and tubulin. (C) KPNA1 half-life is shortened in the presence of Nsp1β expression. HEK293 cells cotransfected with KPNA1-FLAG and VR-2385 Nsp1β plasmids were treated with cycloheximide and harvested at indicated times (h). Empty vector (EV) of Nsp1β plasmid was included as a control. KPNA1, Nsp1β, and tubulin were detected by Western blotting. (D) Densitometry analysis showing fold changes of KPNA1 levels in comparison with the levels at 1 h after cycloheximide (CHX) addition, normalized with tubulin. The KPNA1 half-life in the presence of Nsp1β was shortened from approximately 21 h to 6 h. Error bars represent standard deviations of the results for repeated experiments.
Fig 5
Fig 5
The N-terminal domain of Nsp1β appears to be associated with the KPNA1 degradation. (A) Schematic illustration of full-length (FL) and truncated constructs (D1 to D4) of VR-2385 Nsp1β. The names of the fragments are indicated on the left. The numbers above the lines indicate starting and ending amino acid positions of Nsp1β for the constructs. (B) Overexpression of Nsp1β deletion constructs in HEK293 cells detected by Western blotting with antibody against FLAG. (C) Immunofluorescence assay showing expression of Nsp1β deletion constructs in HeLa cells. In each panel, the left image shows the expression of Nsp1β or the deletion construct and the right image shows nuclear DNA stained with DAPI. (D) Endogenous KPNA1 levels in HEK293 cells with expression of Nsp1β deletion constructs. The cells were transfected with full-length Nsp1β and truncation constructs. Western blotting was done with antibodies against KPNA1 and tubulin. (E) Densitometry analysis showing fold changes of KPNA1 levels in comparison with the levels in cells with empty-vector control after normalization with tubulin. Error bars represent standard deviations of the results for repeated experiments.
Fig 6
Fig 6
The presence of valine-19 in Nsp1β appears to correlate with the KPNA1 reduction. (A) The mutant VR-2385 Nsp1β with isoleucine-19 has no effect on KPNA1 levels. HEK293 cells were cotransfected with KPNA1-FLAG and Nsp1β-HA plasmids. Western blotting was conducted with antibodies against FLAG, HA, and tubulin. VR1, VR-2332; VR, VR-2385; V19I, mutant VR-2385 Nsp1β with a mutation of valine-19 to isoleucine. (B) Densitometry analysis showing fold changes of KPNA1 levels after normalization with tubulin in comparison with the levels in cells with the empty-vector control. (C) The mutant VR-2385 Nsp1β with isoleucine-19 loses inhibitory effect on IFN-induced expression of ISG15 and ISG56. HEK293 cells were transfected with wild-type (VR) or Nsp1β mutant (V19I) plasmids. At 48 h after transfection, the cells were treated with IFN-α at 300 U/ml and, 10 h later, harvested for RNA isolation and RT-qPCR. Fold changes of mRNA levels in comparison with the levels in cells without IFN-α treatment are shown. Significant differences in ISG15 and ISG56 mRNA levels between cells with wild-type Nsp1β and those with mutant or empty vector (EV) are indicated as follows: *, P < 0.05, and **, P < 0.01. Error bars represent standard deviations of the results for repeated experiments. (D) The mutant VR-2385 Nsp1β loses inhibitory effect on IFN-induced elevation of STAT2 protein. Fold changes of STAT2 levels in comparison with the levels in cells with empty-vector control are shown below the images. (E) The mutant MLV Nsp1β with valine-19 acquires inhibitory effect on KPNA1 levels. HEK293 cells were cotransfected with KPNA1-FLAG and wild-type (MLV) or mutant Nsp1β (I19V) plasmids. Empty vector and VR-2385 Nsp1β plasmid were included for control. (F) Densitometry analysis showing fold changes of KPNA1 levels after normalization with tubulin in comparison with the levels in cells with the empty-vector control. Error bars represent standard deviations of the results for repeated experiments.
Fig 7
Fig 7
Reduction of endogenous KPNA1 levels by infection with PRRSV strains VR-2385 and VR-2332. (A) Endogenous KPNA1 protein levels in MARC-145 cells after PRRSV infection. MARC-145 cells were infected with PRRSV strain VR-2385, MLV, or VR-2332 and harvested 24 h.p.i. for Western blotting. Lysate of mock-infected cells was included as a control. Fold changes of KPNA1 protein levels are shown below the images. VR, VR-2385; VR1, VR-2332. (B) KPNA1 mRNA levels in MARC-145 cells after PRRSV infection. RT-qPCR was done to quantify KPNA1 mRNA at 24 h.p.i. Fold changes in comparison with the levels in mock-infected cells are shown. Error bars represent standard deviations of the results for repeated experiments. (C) PRRSV RNA in MARC-145 cells detected by RT-qPCR. Fold changes in comparison with the amounts of mRNA in VR-2332-infected cells are shown. Significant differences between viral RNA levels are indicated as follows: *, P < 0.05, and **, P < 0.01. Error bars represent standard deviations of the results for repeated experiments. (D) Kinetics of endogenous KPNA1 levels in MARC-145 cells after VR-2385 infection. The cells were harvested at the indicated times (h) after infection. Fold changes of KPNA1 levels are shown below the images.

Similar articles

Cited by

References

    1. Faaberg KS, Balasuriya UB, Brinton MA, Gorbalenya AE, Leung FC-C, Nauwynck H, Snijder EJ, Stadejek T, Yang H, Yoo D. 2011. Family Arteriviridae. In King AMQ, Lefkowitz E, Adams MJ, Carstens EB. (ed), Virus taxonomy. Ninth report of the International Committee on Taxonomy of Viruses. Elsevier Academic Press, London, United Kingdom
    1. Neumann EJ, Kliebenstein JB, Johnson CD, Mabry JW, Bush EJ, Seitzinger AH, Green AL, Zimmerman JJ. 2005. Assessment of the economic impact of porcine reproductive and respiratory syndrome on swine production in the United States. J. Am. Vet. Med. Assoc. 227:385–392 - PubMed
    1. Conzelmann KK, Visser N, Van Woensel P, Thiel HJ. 1993. Molecular characterization of porcine reproductive and respiratory syndrome virus, a member of the arterivirus group. Virology 193:329–339 - PMC - PubMed
    1. Meulenberg JJ, de Meijer EJ, Moormann RJ. 1993. Subgenomic RNAs of Lelystad virus contain a conserved leader-body junction sequence. J. Gen. Virol. 74(Pt 8):1697–1701 - PubMed
    1. Mardassi H, Mounir S, Dea S. 1995. Molecular analysis of the ORFs 3 to 7 of porcine reproductive and respiratory syndrome virus, Quebec reference strain. Arch. Virol. 140:1405–1418 - PMC - PubMed

Publication types

MeSH terms

LinkOut - more resources