. 2013 Jun;11(6):638-50.
doi: 10.1158/1541-7786.MCR-12-0634-T. Epub 2013 Feb 28.

Human lung epithelial cells progressed to malignancy through specific oncogenic manipulations

Affiliations

Human lung epithelial cells progressed to malignancy through specific oncogenic manipulations

Mitsuo Sato et al. Mol Cancer Res. 2013 Jun.

Abstract

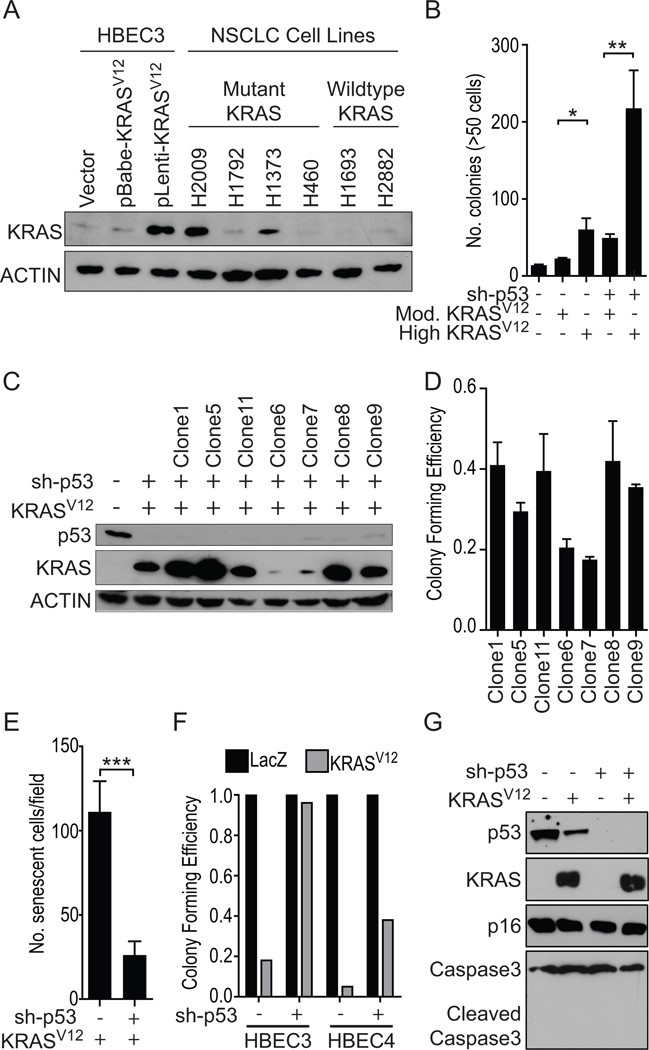
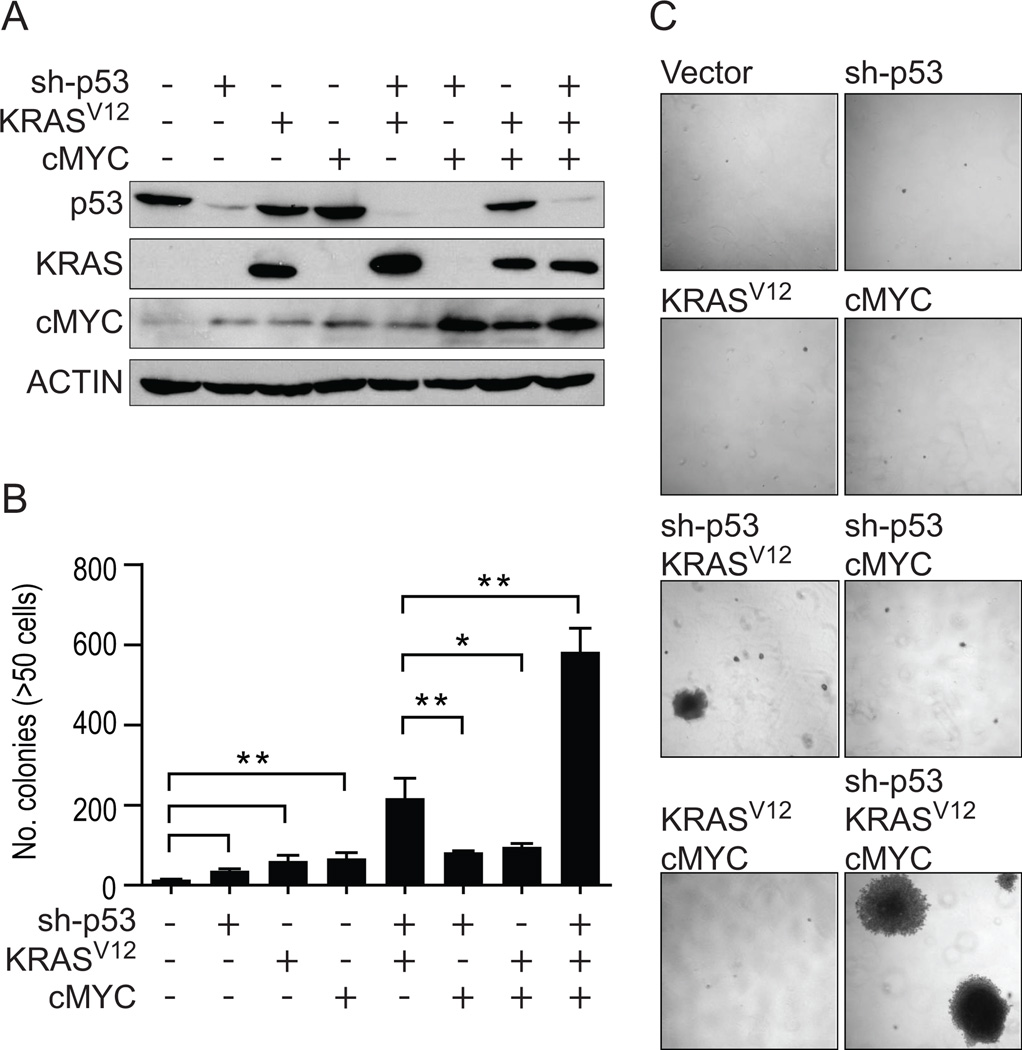
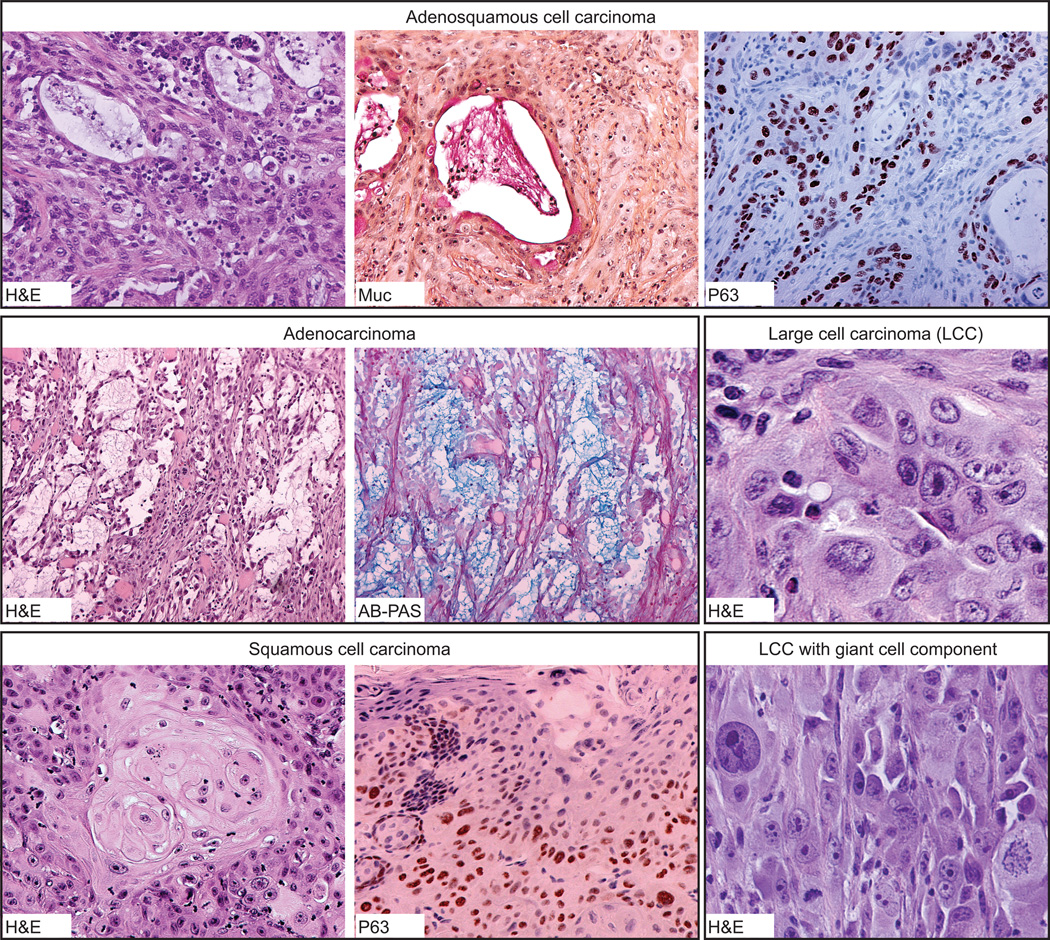
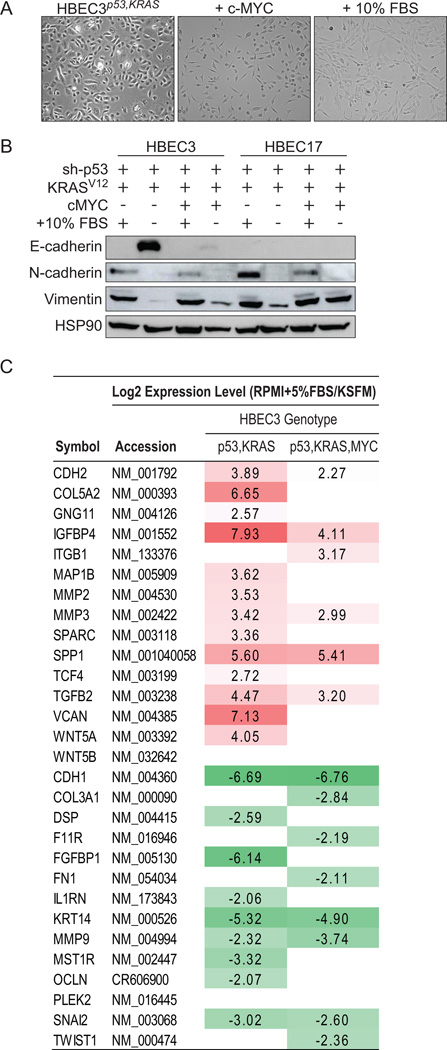
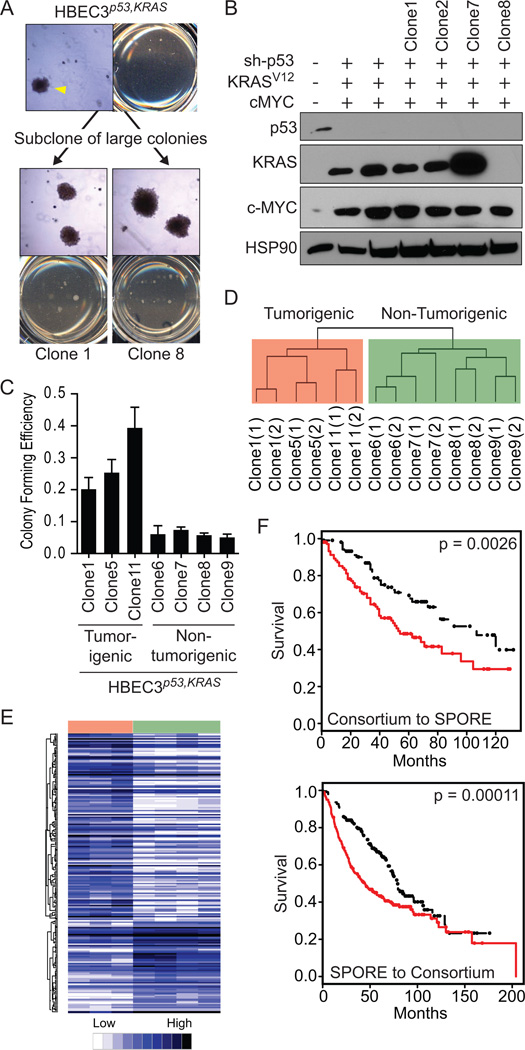
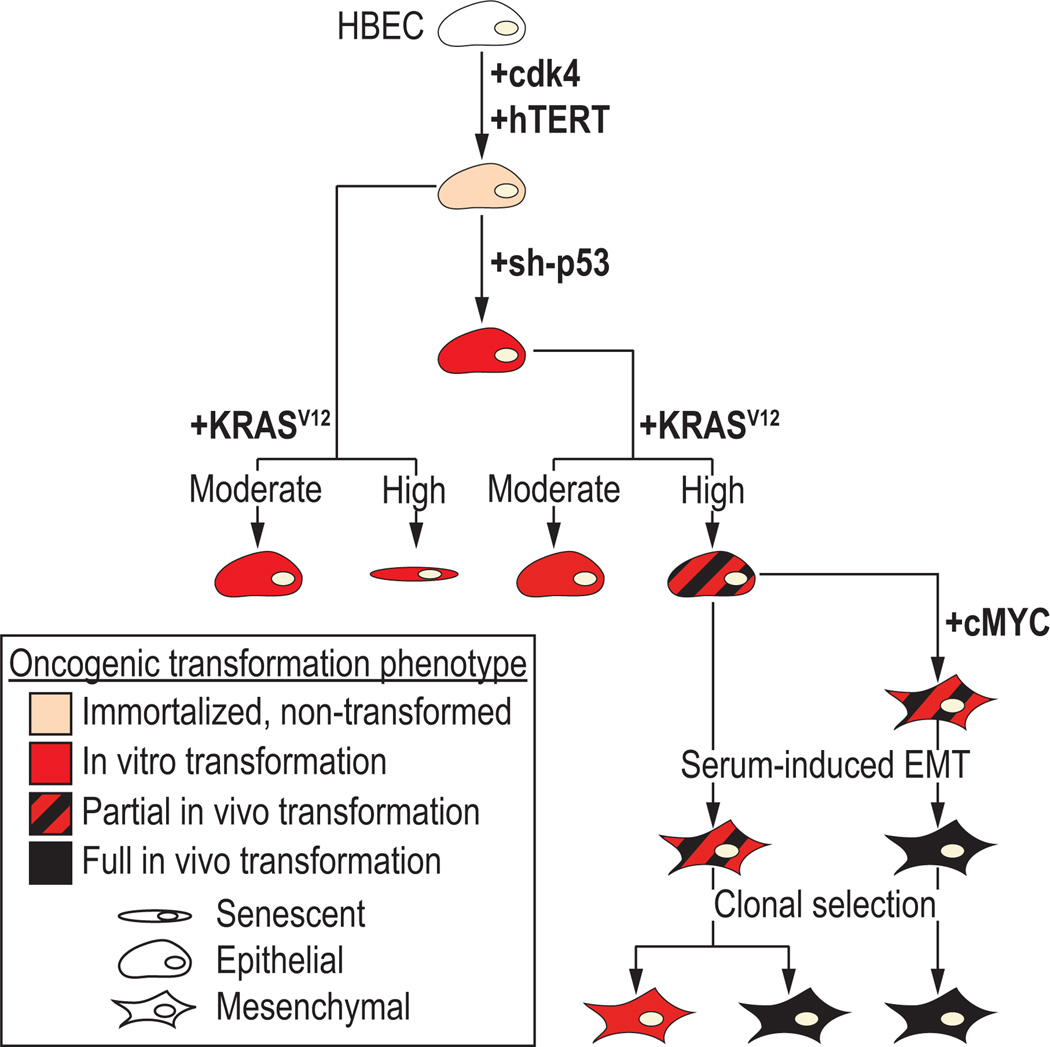
We used CDK4/hTERT-immortalized normal human bronchial epithelial cells (HBEC) from several individuals to study lung cancer pathogenesis by introducing combinations of common lung cancer oncogenic changes (p53, KRAS, and MYC) and followed the stepwise transformation of HBECs to full malignancy. This model showed that: (i) the combination of five genetic alterations (CDK4, hTERT, sh-p53, KRAS(V12), and c-MYC) is sufficient for full tumorigenic conversion of HBECs; (ii) genetically identical clones of transformed HBECs exhibit pronounced differences in tumor growth, histology, and differentiation; (iii) HBECs from different individuals vary in their sensitivity to transformation by these oncogenic manipulations; (iv) high levels of KRAS(V12) are required for full malignant transformation of HBECs, however, prior loss of p53 function is required to prevent oncogene-induced senescence; (v) overexpression of c-MYC greatly enhances malignancy but only in the context of sh-p53+KRAS(V12); (vi) growth of parental HBECs in serum-containing medium induces differentiation, whereas growth of oncogenically manipulated HBECs in serum increases in vivo tumorigenicity, decreases tumor latency, produces more undifferentiated tumors, and induces epithelial-to-mesenchymal transition (EMT); (vii) oncogenic transformation of HBECs leads to increased sensitivity to standard chemotherapy doublets; (viii) an mRNA signature derived by comparing tumorigenic versus nontumorigenic clones was predictive of outcome in patients with lung cancer. Collectively, our findings show that this HBEC model system can be used to study the effect of oncogenic mutations, their expression levels, and serum-derived environmental effects in malignant transformation, while also providing clinically translatable applications such as development of prognostic signatures and drug response phenotypes.


Conflict of interest statement

The authors disclose no potential conflicts of interest.

Figures

Figure 1
Figure 1. High exogenous levels of KRASV12, comparable to endogenous levels found in mutant KRAS NSCLC cell lines, increases transformation of HBECs and induces senescence, which is largely bypassed with p53 knockdown
A) Immunoblot for KRAS protein expression in HBEC3 cells infected with KRASV12 using either a moderately-expressing retroviral (pBabe-hyg-KRASV12) or high-expressing lentiviral (pL6-KRASV12) vector. Actin was used as loading control. B) Anchorage-independent (soft agar) colony formation in HBEC3 with high (lentiviral) or moderate (retroviral) levels of KRASV12 in the background of both wildtype p53 and p53 knockdown (sh-p53) (t-test). C) Immunoblot of HBEC3p53,KRAS soft agar clones confirming p53 and KRASV12 manipulations. The presence (+) or absence (−) of each manipulation is shown. D) Anchorage-dependent (liquid) colony formation ability of HBEC3p53,KRAS soft agar clones. E) Quantification of SA-β-gal staining found KRASV12-induced senescence in HBEC3 cells was significantly lower in cells with p53 knockdown compared with p53 wildtype (t-test). F) Anchorage-dependent colony formation assay to compare acute KRASV12-induced toxicity in HBEC3 and HBEC4 with wildtype p53 or p53 knockdown. G) Immunoblot of HBEC3 cell lysates harvested seven days after infection with KRASV12 or LacZ lentivirus. *P < 0.05, **P < 0.01, ***P < 0.001. Full-length blots are presented in Supplementary Figure S8).
Figure 2
Figure 2. Stepwise in vitro transformation of HBEC3 with sh-p53, KRASV12 and c-MYC
A) Immunoblot of isogenic derivatives of HBEC3 with sh-p53, or over-expression of KRASV12 or c-MYC, alone or in combination. The presence (+) or absence (−) of each manipulation is shown.B) Transformation as defined by anchorage-independent growth in soft agar assays for HBEC3 with each manipulation alone or in combination. C) Representative photographs of soft agar assays showing the formation of large, macroscopic (>1mm) colonies in HBEC3p53,KRAS and HBEC3p53,KRAS,MYC (4X magnification). Full-length blots are presented in Supplementary Figure S8.
Figure 3
Figure 3. Representative formalin-fixed paraffin-embedded sections of subcutaneous xenografts derived from HBEC3p53,KRAS and HBEC3p53,KRAS,MYC
HBEC3p53,KRAS and HBEC3p53,KRAS,MYC formed subcutaneous tumor reflective of naturally arising lung carcinomas with adenosquamous differentiation (top panel), adenocarcinoma (middle panel on left), and squamous differentiation (lower panel on left), as well as undifferentiated large cell carcinomas, some of which also exhibited a giant cell component (middle and lower panels on right). Squamous and adenocarcinoma differentiation was confirmed with p63 and mucicarmine and/or alcian-blue PAS staining, respectively. The example of adenosquamous cell carcinoma (top panel) clearly shows dual differentiation of peripheral squamous/basal-like cells (p63+/mucin−) and central glandular cells (p63−/mucin+). H&E, hematoxylin and eosin; Muc, mucicarmine; AB-PAS, alcian-blue PAS. Original magnification of images at 10X except adenosquamous H&E and P63 (20X); Large cell carcinoma with giant cell component H&E (20X); and Large cell carcinoma H&E (40X).
Figure 4
Figure 4. c-MYC over-expression or growth in serum-containing media induces EMT in HBEC3p53,KRAS
A) Phase contrast photomicrographs showing the morphological effect observed in HBEC3p53,KRAS (left) following over-expression of c-MYC (middle) or switching from defined serum-free media to serum-containing media (right) (20X magnification). B) Immunoblot for EMT markers in oncogenically manipulated HBEC3 and HBEC17 grown in either KSFM (serum free) or serum-containing (R10) media. The presence (+) or absence (−) of serum is shown. C) EMT-related genes altered 4-fold or greater in pairwise analysis of HBEC3p53,KRAS and HBEC3p53,KRAS,cMYC comparing cells grown in serum or defined medium (KSFM). Values log2 transformed. *P < 0.05, **P < 0.01 (t-test). Full-length blots are presented in Supplementary Figure S8).
Figure 5
Figure 5. Isolation of large soft agar clones from HBEC3p53,KRAS and HBEC3p53,KRAS,MYC identifies tumorigenic and non-tumorigenic clones and genome-wide mRNA expression profiling of HBEC3p53,KRAS soft agar clones identifies a clinically-applicable signature of prognosis
A) Uncloned, parental populations of HBEC3p53,KRAS and HBEC3p53,KRAS,MYC form very large (>1mm diameter) soft agar colonies (arrowhead). These large colonies were isolated, expanded, and retested for soft agar colony formation where they maintained the ability to form large soft agar colonies (representative soft agar pictures of two clones) (4X magnification). B) Immunoblot of HBEC3p53,KRAS,MYC soft agar clones confirming p53, KRASV12 and c-MYC manipulations. The presence (+) or absence (−) of each manipulation is shown. C) Anchorage-independent soft agar colony formation ability of HBEC3p53,KRAS soft agar clones. D) Unsupervised hierarchical clustering of whole-genome mRNA expression profiles of HBEC3p53,KRAS soft agar clones harvested at two time points (denoted “(1)” and “(2)”) spanning a three week interval. E) A supervised analysis comparing HBEC3p53,KRAS tumorigenic (Clone1, Clone5, and Clone11) with HBEC3p53,KRAS non-tumorigenic (Clone6, Clone7, Clone8, and Clone9) clones identified 203 probes, representing 171 unique genes, significantly differentially expressed (SAM, FDR = 5%). Samples (represented horizontally: red, tumorigenic clones; green, non-tumorigenic clones) and probes (represented vertically) were clustered using centered Pearson clustering. F) Kaplan-Meier log-rank analysis of overall survival in lung cancer patients predicted to have good (black) or poor (red) outcome using the 171 probe signature HBEC3p53,KRAS soft agar signature. A supervised principal component analysis was used to train the model in one dataset (Consortium) and test in a second dataset (SPORE) (above) then the datasets were reversed to test for model robustness (below). Full-length blots are presented in Supplementary Figure S8).
Figure 6
Figure 6. Model of malignant transformation of in vitro human bronchial epithelial cells (HBECs) following stepwise introduction of common lung cancer mutations
The experimental data presented in this paper identify the following steps: Step 1, CDK4 and hTERT immortalized, human bronchial epithelial cells (HBECs) are non-transformed and lack of anchorage-independent growth in soft agar; Step 2, in vitro transformation as defined by anchorage-independent growth in soft agar is achieved with the single manipulation of loss of p53, moderate KRASV12 expression or both, while expression of high levels of KRASV12 expression leads to in vitro transformation with significant cellular senescence; Step 3, partial in vivo transformation with subcutaneous tumor growth in immunocompromised mice in 30–80% of injections is observed with the combination of p53 loss and high KRASV12; Step 4, an epithelial to mesenchymal transition (EMT) occurs following over-expression of cMYC or growth in serum-containing media; Step 5, combination of cMYC over-expression and growth in serum-containing media results in complete oncogenic transformation of HBECs with tumor growth in vivo observed in >80% of injections in immunocompromised mice. Clonal selection of partially transformed HBECs identifies tumorigenic and non-tumorigenic clones.

References

    1. Larsen JE, Minna JD. Molecular biology of lung cancer: clinical implications. Clin Chest Med. 2011;32:703–740. - PMC - PubMed
    1. Ding L, Getz G, Wheeler DA, Mardis ER, McLellan MD, Cibulskis K, et al. Somatic mutations affect key pathways in lung adenocarcinoma. Nature. 2008;455:1069–1075. - PMC - PubMed
    1. Imielinski M, Berger AH, Hammerman PS, Hernandez B, Pugh TJ, Hodis E, et al. Mapping the hallmarks of lung adenocarcinoma with massively parallel sequencing. Cell. 2012;150:1107–1120. - PMC - PubMed
    1. Rudin CM, Durinck S, Stawiski EW, Poirier JT, Modrusan Z, Shames DS, et al. Comprehensive genomic analysis identifies SOX2 as a frequently amplified gene in small-cell lung cancer. Nat Genet. 2012 - PMC - PubMed
    1. Govindan R, Ding L, Griffith M, Subramanian J, Dees ND, Kanchi KL, et al. Genomic landscape of non-small cell lung cancer in smokers and never-smokers. Cell. 2012;150:1121–1134. - PMC - PubMed

Publication types

MeSH terms