. 2013 Jul;268(1):69-78.
doi: 10.1148/radiol.13121351. Epub 2013 Feb 28.

Automated detection of sclerotic metastases in the thoracolumbar spine at CT

Affiliations

Automated detection of sclerotic metastases in the thoracolumbar spine at CT

Joseph E Burns et al. Radiology. 2013 Jul.

Erratum in

  • Response.
    Zuo YZ, Liu SW. Zuo YZ, et al. Radiology. 2013 Oct;269(1):311. doi: 10.1148/radiol.13134028. Radiology. 2013. PMID: 24191350 Free PMC article. No abstract available.

Abstract

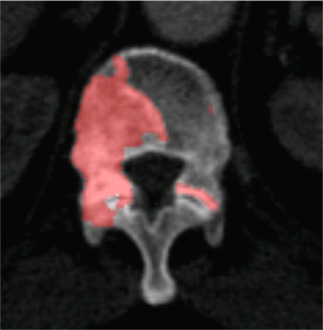
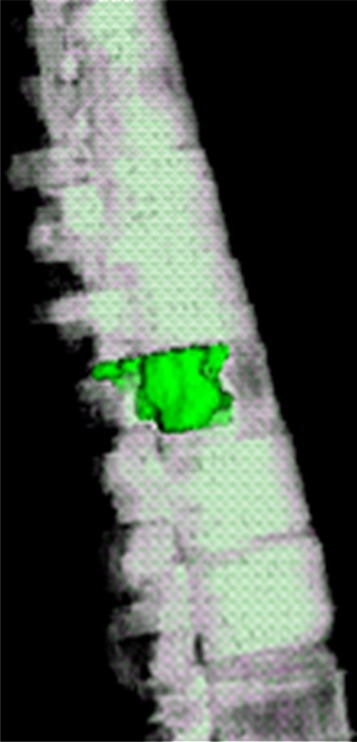
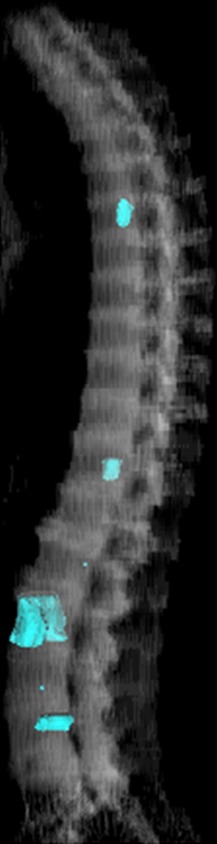
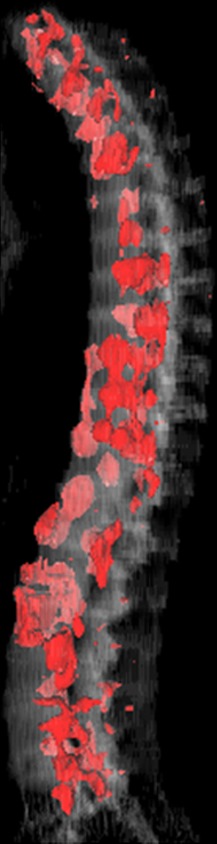
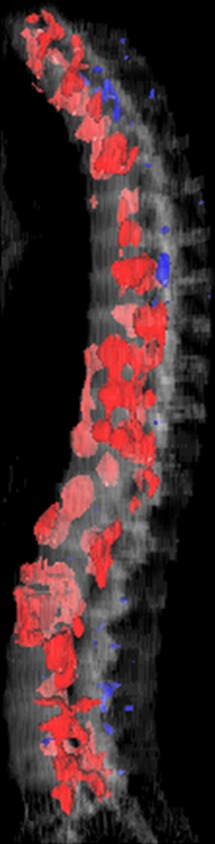
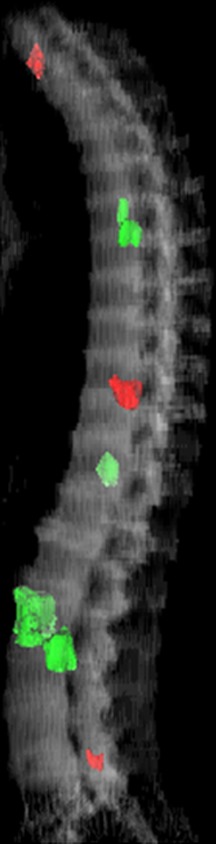
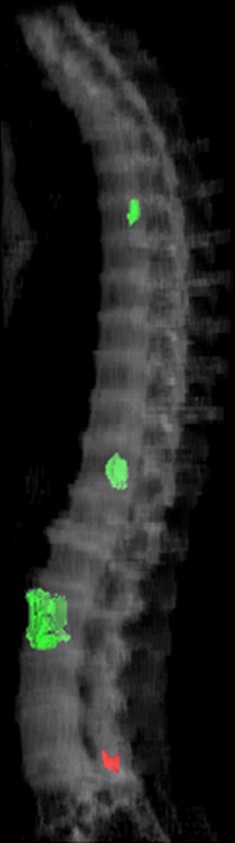
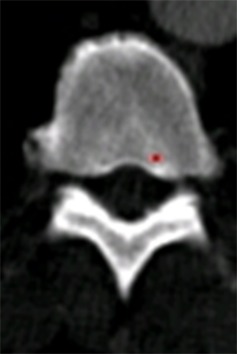
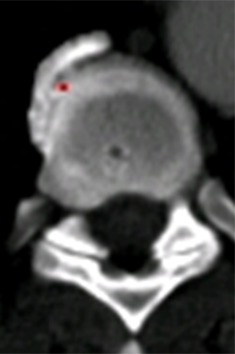
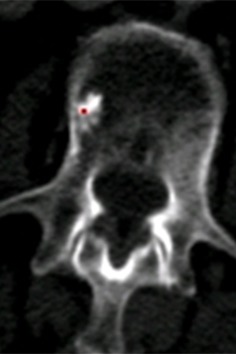
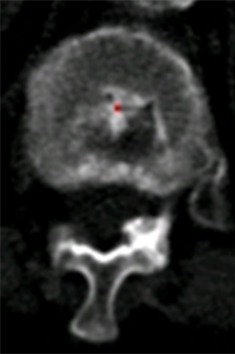
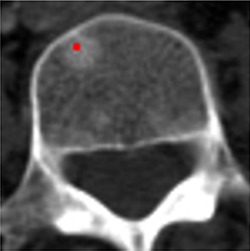
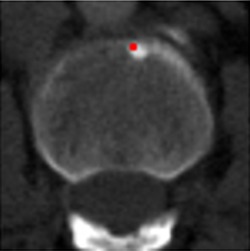
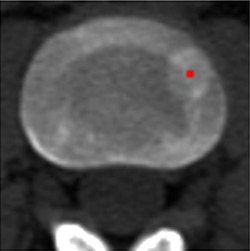
Purpose: To design and validate a computer system for automated detection and quantitative characterization of sclerotic metastases of the thoracolumbar spine on computed tomography (CT) images.

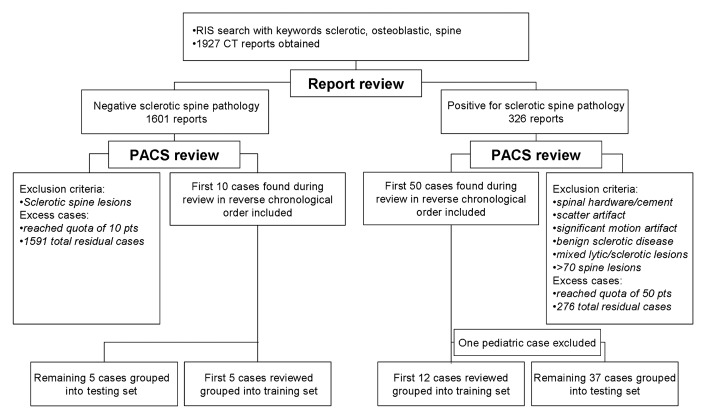
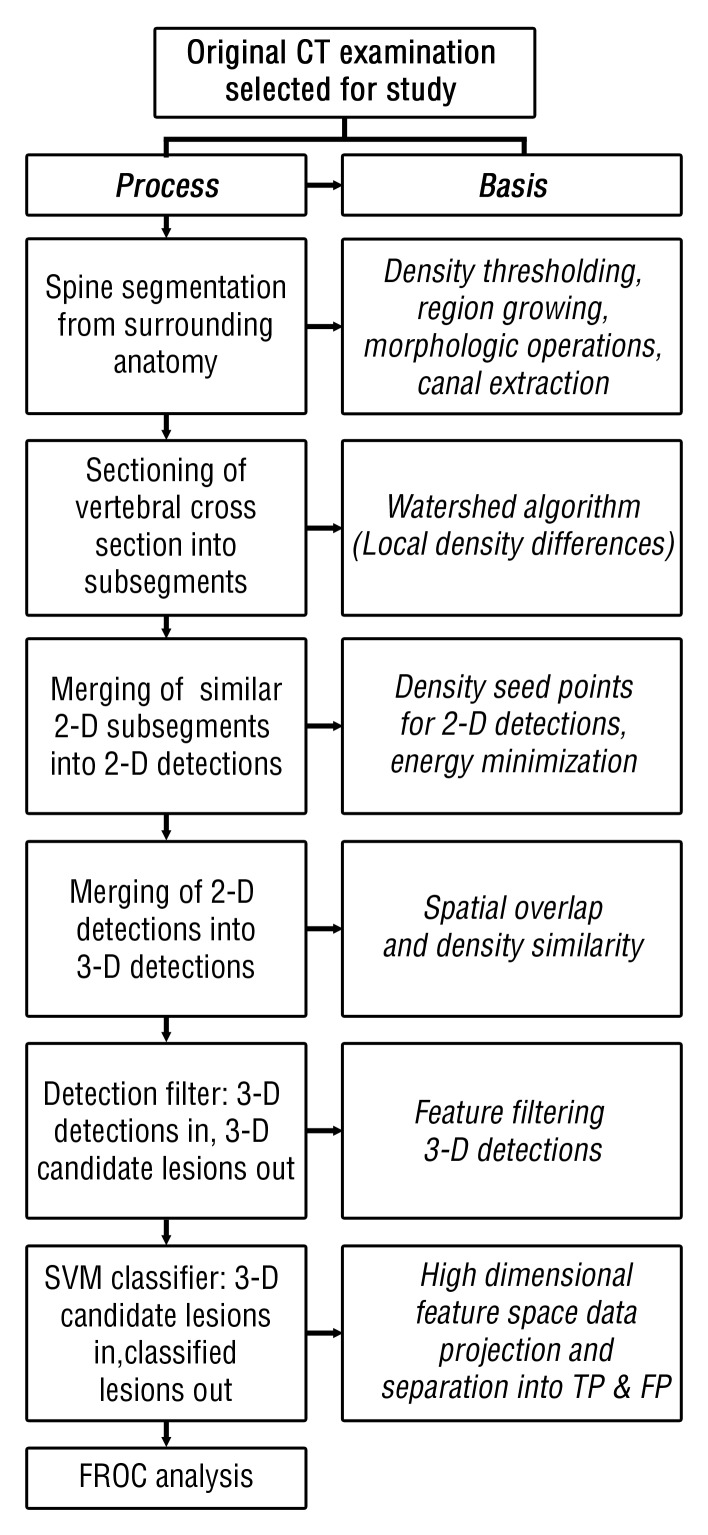
Materials and methods: This retrospective study was approved by the institutional review board and was HIPAA compliant; informed consent was waived. The data set consisted of CT examinations in 49 patients (14 female, 35 male patients; mean age, 57.0 years; range, 12-77 years), demonstrating a total of 532 sclerotic lesions of the spine of greater than 0.3 cm(3) in volume, and in 10 control case patients (four women, six men; mean age, 55.2 years; range, 19-70 years) without spinal lesions. CT examinations were divided into training and test sets, and images were analyzed according to prototypical fully-automated computer-aided detection (CAD) software. Free-response receiver operating characteristic analysis was performed.

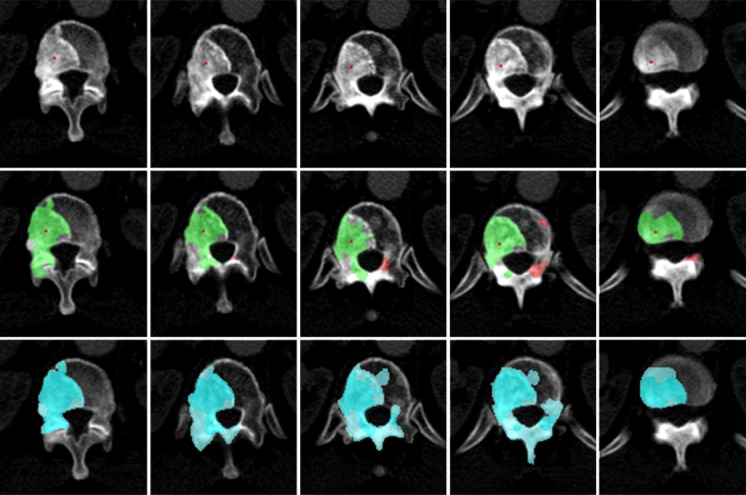
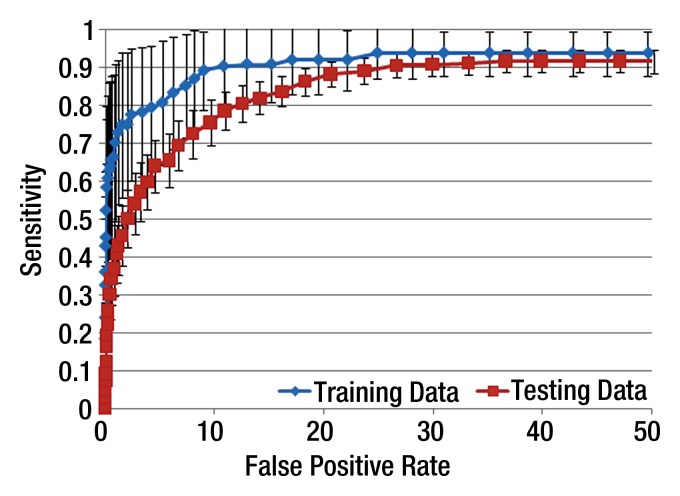
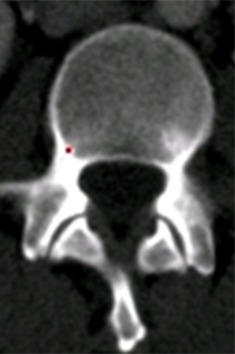
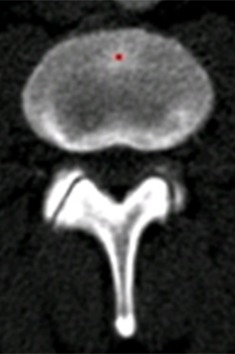
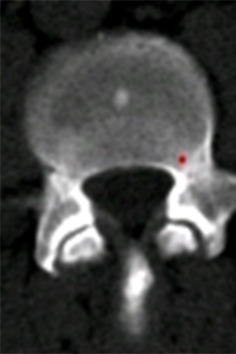
Results: Lesion detection sensitivity on images in the training set was 90%, relative to reference-standard marked lesions (95% confidence interval [CI]: 83%, 97%), at a false-positive rate (FPR) of 10.8 per patient (95% CI: 6.6, 15.0). For images in the testing set, sensitivity was 79% (95% CI: 74%, 84%), with an FPR of 10.9 per patient (95% CI: 8.5, 13.3). False-negative findings were most commonly (37 [40%] of 93) a result of endplate proximity, with 32 (34% of 93) caused by low CT attenuation. Marginal sclerosis caused by degenerative change (174 [28.1%] of 620 actual detections) was the most common cause of false-positive detections, followed by partial volume averaging with vertebral endplates (173 [27.9%] of 620) and pedicle cortex parallel to the axial imaging plane (121 [19.5%] 620).

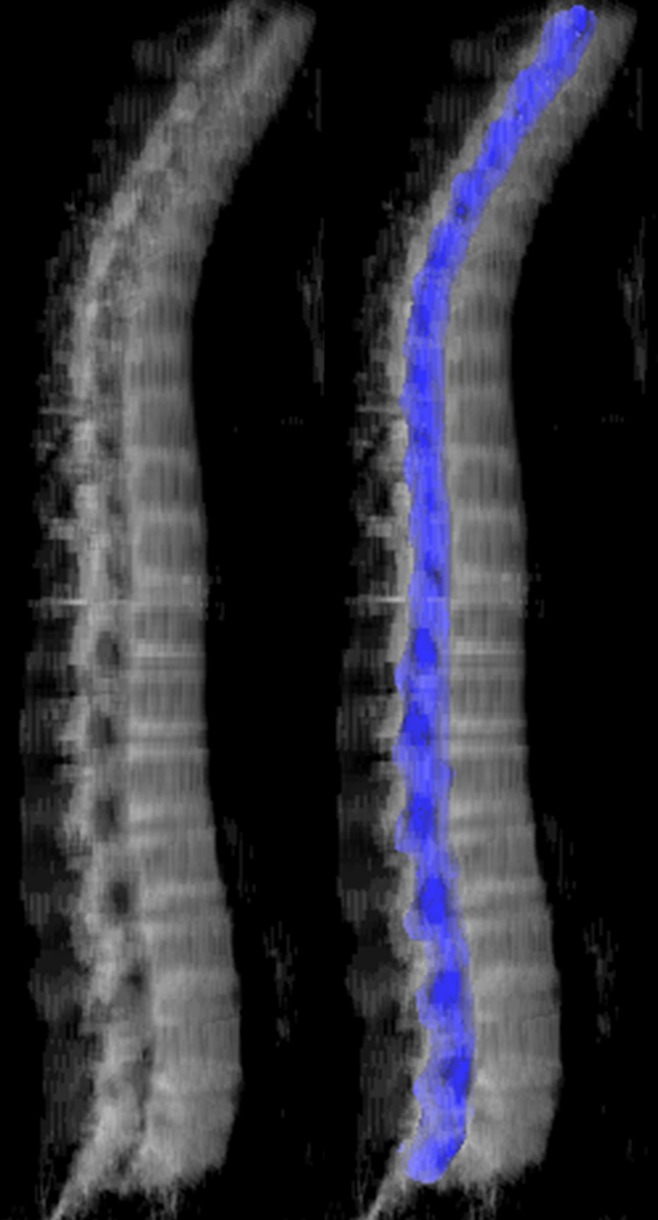
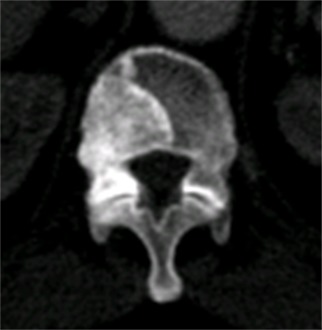
Conclusion: This CAD system successfully identified and segmented sclerotic lesions in the thoracolumbar spine.


Figures

Figure 1:
Figure 1:
Standards for Reporting of Diagnostic Accuracy chart. PACS = picture archiving and communication system, pts = patients, RIS = Radiology Information System.
Figure 2:
Figure 2:
Flowchart of CAD methods. Density = attenuation, FP = false-positive, FROC = free-response receiver operating characteristic, SVM = support vector machine, TP = true-positive.
Figure 3:
Figure 3:
Spine segmentation results in a 66-year-old patient with prostate cancer. Illustration of the first step in the CAD system image processing algorithm. Left: Automated stripping of surrounding anatomy (including ribs) from the vertebrae is performed on axial CT images by the segmentation software, followed by 3D reconstruction of the spine. Right: Automated identification of the spinal canal is performed as part of this process to assist in isolation and identification of the vertebrae by the segmentation software. Spinal canal here is marked in blue (spinal canal set as translucent at left).
Figure 4a:
Figure 4a:
Lesion detection and 2D merging algorithm revealed a T12 vertebral body lesion in a 70-year-old patient with prostate cancer. (a) Original axial CT image, with heterogeneous sclerotic lesion or conglomeration of sclerotic lesions. (b) Watershed segmentation of axial CT cross section before 2D merging. (c) Lesion segmentation after 2D merging. (d) Axial CT image with merged 2D lesion detection in red.
Figure 4b:
Figure 4b:
Lesion detection and 2D merging algorithm revealed a T12 vertebral body lesion in a 70-year-old patient with prostate cancer. (a) Original axial CT image, with heterogeneous sclerotic lesion or conglomeration of sclerotic lesions. (b) Watershed segmentation of axial CT cross section before 2D merging. (c) Lesion segmentation after 2D merging. (d) Axial CT image with merged 2D lesion detection in red.
Figure 4c:
Figure 4c:
Lesion detection and 2D merging algorithm revealed a T12 vertebral body lesion in a 70-year-old patient with prostate cancer. (a) Original axial CT image, with heterogeneous sclerotic lesion or conglomeration of sclerotic lesions. (b) Watershed segmentation of axial CT cross section before 2D merging. (c) Lesion segmentation after 2D merging. (d) Axial CT image with merged 2D lesion detection in red.
Figure 4d:
Figure 4d:
Lesion detection and 2D merging algorithm revealed a T12 vertebral body lesion in a 70-year-old patient with prostate cancer. (a) Original axial CT image, with heterogeneous sclerotic lesion or conglomeration of sclerotic lesions. (b) Watershed segmentation of axial CT cross section before 2D merging. (c) Lesion segmentation after 2D merging. (d) Axial CT image with merged 2D lesion detection in red.
Figure 5a:
Figure 5a:
Merging of a candidate lesion, 2D to 3D in same patient and spinal level as in Figure 4. (a) Original CT images (top), computer-segmented 2D detections (middle, green), and manually segmented lesions (bottom, blue) on adjacent axial sections. Individual red pixel on each axial section is the CAD system detection mark. Red on images in middle represents other CADs in same vertebra. (b) Three-dimensional lesion (dark green) after merging of the axial 2D detections.
Figure 5b:
Figure 5b:
Merging of a candidate lesion, 2D to 3D in same patient and spinal level as in Figure 4. (a) Original CT images (top), computer-segmented 2D detections (middle, green), and manually segmented lesions (bottom, blue) on adjacent axial sections. Individual red pixel on each axial section is the CAD system detection mark. Red on images in middle represents other CADs in same vertebra. (b) Three-dimensional lesion (dark green) after merging of the axial 2D detections.
Figure 6a:
Figure 6a:
Three-dimensional detection filtering and final classification in a 75-year-old patient with prostate cancer. (a) Three-dimensional reconstruction of segmented spine data with ground truth lesions marked in light blue. (b) Initial output of detections (red) from 2D watershed and 3D merging algorithms. (c) Candidate lesions (red) remaining after screening by detection filter. Rejected detections in blue. (d, e) Lesions remaining after SVM classification with cutoff of 0.48 (d) and 0.55 (e) (for comparison). Green = true-positive lesions, red = FP lesions. FP detections here were caused by degenerative change and partial volume averaging of vertebral endplates.
Figure 6b:
Figure 6b:
Three-dimensional detection filtering and final classification in a 75-year-old patient with prostate cancer. (a) Three-dimensional reconstruction of segmented spine data with ground truth lesions marked in light blue. (b) Initial output of detections (red) from 2D watershed and 3D merging algorithms. (c) Candidate lesions (red) remaining after screening by detection filter. Rejected detections in blue. (d, e) Lesions remaining after SVM classification with cutoff of 0.48 (d) and 0.55 (e) (for comparison). Green = true-positive lesions, red = FP lesions. FP detections here were caused by degenerative change and partial volume averaging of vertebral endplates.
Figure 6c:
Figure 6c:
Three-dimensional detection filtering and final classification in a 75-year-old patient with prostate cancer. (a) Three-dimensional reconstruction of segmented spine data with ground truth lesions marked in light blue. (b) Initial output of detections (red) from 2D watershed and 3D merging algorithms. (c) Candidate lesions (red) remaining after screening by detection filter. Rejected detections in blue. (d, e) Lesions remaining after SVM classification with cutoff of 0.48 (d) and 0.55 (e) (for comparison). Green = true-positive lesions, red = FP lesions. FP detections here were caused by degenerative change and partial volume averaging of vertebral endplates.
Figure 6d:
Figure 6d:
Three-dimensional detection filtering and final classification in a 75-year-old patient with prostate cancer. (a) Three-dimensional reconstruction of segmented spine data with ground truth lesions marked in light blue. (b) Initial output of detections (red) from 2D watershed and 3D merging algorithms. (c) Candidate lesions (red) remaining after screening by detection filter. Rejected detections in blue. (d, e) Lesions remaining after SVM classification with cutoff of 0.48 (d) and 0.55 (e) (for comparison). Green = true-positive lesions, red = FP lesions. FP detections here were caused by degenerative change and partial volume averaging of vertebral endplates.
Figure 6e:
Figure 6e:
Three-dimensional detection filtering and final classification in a 75-year-old patient with prostate cancer. (a) Three-dimensional reconstruction of segmented spine data with ground truth lesions marked in light blue. (b) Initial output of detections (red) from 2D watershed and 3D merging algorithms. (c) Candidate lesions (red) remaining after screening by detection filter. Rejected detections in blue. (d, e) Lesions remaining after SVM classification with cutoff of 0.48 (d) and 0.55 (e) (for comparison). Green = true-positive lesions, red = FP lesions. FP detections here were caused by degenerative change and partial volume averaging of vertebral endplates.
Figure 7:
Figure 7:
FROC analysis for training and testing sets. Training set FROC curve of SVM performance demonstrates 90% sensitivity (95% CI: 83%, 97%) at FPR of 10.8 lesions per patient. Testing set FROC curve of SVM performance (red) demonstrates 79% sensitivity (95% CI: 74%, 84%) at FPR of 10.9 lesions per patient.
Figure 8a:
Figure 8a:
FP detections. Axial CT sections demonstrate FP detections (marked with a red pixel) owing to the following: (a) cortex of neuroforamen, (b) cortex of vertebral endplate, (c) combination of neuroforaminal cortex and neurocentral synchondrosis scar, (d) sclerotic intraosseous channel wall of basivertebral neurovascular bundle, (e) degenerative sclerosis of an anterolateral osteophyte, (f) bone island, and (g) sclerotic Schmorl node margin.
Figure 8b:
Figure 8b:
FP detections. Axial CT sections demonstrate FP detections (marked with a red pixel) owing to the following: (a) cortex of neuroforamen, (b) cortex of vertebral endplate, (c) combination of neuroforaminal cortex and neurocentral synchondrosis scar, (d) sclerotic intraosseous channel wall of basivertebral neurovascular bundle, (e) degenerative sclerosis of an anterolateral osteophyte, (f) bone island, and (g) sclerotic Schmorl node margin.
Figure 8c:
Figure 8c:
FP detections. Axial CT sections demonstrate FP detections (marked with a red pixel) owing to the following: (a) cortex of neuroforamen, (b) cortex of vertebral endplate, (c) combination of neuroforaminal cortex and neurocentral synchondrosis scar, (d) sclerotic intraosseous channel wall of basivertebral neurovascular bundle, (e) degenerative sclerosis of an anterolateral osteophyte, (f) bone island, and (g) sclerotic Schmorl node margin.
Figure 8d:
Figure 8d:
FP detections. Axial CT sections demonstrate FP detections (marked with a red pixel) owing to the following: (a) cortex of neuroforamen, (b) cortex of vertebral endplate, (c) combination of neuroforaminal cortex and neurocentral synchondrosis scar, (d) sclerotic intraosseous channel wall of basivertebral neurovascular bundle, (e) degenerative sclerosis of an anterolateral osteophyte, (f) bone island, and (g) sclerotic Schmorl node margin.
Figure 8e:
Figure 8e:
FP detections. Axial CT sections demonstrate FP detections (marked with a red pixel) owing to the following: (a) cortex of neuroforamen, (b) cortex of vertebral endplate, (c) combination of neuroforaminal cortex and neurocentral synchondrosis scar, (d) sclerotic intraosseous channel wall of basivertebral neurovascular bundle, (e) degenerative sclerosis of an anterolateral osteophyte, (f) bone island, and (g) sclerotic Schmorl node margin.
Figure 8f:
Figure 8f:
FP detections. Axial CT sections demonstrate FP detections (marked with a red pixel) owing to the following: (a) cortex of neuroforamen, (b) cortex of vertebral endplate, (c) combination of neuroforaminal cortex and neurocentral synchondrosis scar, (d) sclerotic intraosseous channel wall of basivertebral neurovascular bundle, (e) degenerative sclerosis of an anterolateral osteophyte, (f) bone island, and (g) sclerotic Schmorl node margin.
Figure 8g:
Figure 8g:
FP detections. Axial CT sections demonstrate FP detections (marked with a red pixel) owing to the following: (a) cortex of neuroforamen, (b) cortex of vertebral endplate, (c) combination of neuroforaminal cortex and neurocentral synchondrosis scar, (d) sclerotic intraosseous channel wall of basivertebral neurovascular bundle, (e) degenerative sclerosis of an anterolateral osteophyte, (f) bone island, and (g) sclerotic Schmorl node margin.
Figure 9a:
Figure 9a:
False-negative detections. Axial CT sections show false-negative detections (marked with a red pixel) owing to the following: (a) low CT attenuation and (b) small volume, and (c) lesion is near vertebral body endplate and has low attenuation.
Figure 9b:
Figure 9b:
False-negative detections. Axial CT sections show false-negative detections (marked with a red pixel) owing to the following: (a) low CT attenuation and (b) small volume, and (c) lesion is near vertebral body endplate and has low attenuation.
Figure 9c:
Figure 9c:
False-negative detections. Axial CT sections show false-negative detections (marked with a red pixel) owing to the following: (a) low CT attenuation and (b) small volume, and (c) lesion is near vertebral body endplate and has low attenuation.

Similar articles

Cited by

References

    1. Doi K. Overview on research and development of computer-aided diagnostic schemes. Semin Ultrasound CT MR 2004;25(5):404–410 - PubMed
    1. Doi K. Computer-aided diagnosis in medical imaging: historical review, current status and future potential. Comput Med Imaging Graph 2007;31(4-5):198–211 - PMC - PubMed
    1. Dachman AH, Obuchowski NA, Hoffmeister JW, et al. Effect of computer-aided detection for CT colonography in a multireader, multicase trial. Radiology 2010;256(3):827–835 - PMC - PubMed
    1. Morton MJ, Whaley DH, Brandt KR, Amrami KK. Screening mammograms: interpretation with computer-aided detection—prospective evaluation. Radiology 2006;239(2):375–383 - PubMed
    1. Timp S, Varela C, Karssemeijer N. Computer-aided diagnosis with temporal analysis to improve radiologists’ interpretation of mammographic mass lesions. IEEE Trans Inf Technol Biomed 2010;14(3):803–808 - PubMed

Publication types

MeSH terms