

A mathematical model of forgetting and amnesia
- PMID: 23450438
- PMCID: PMC3584298
- DOI: 10.3389/fpsyg.2013.00076
A mathematical model of forgetting and amnesia
Abstract
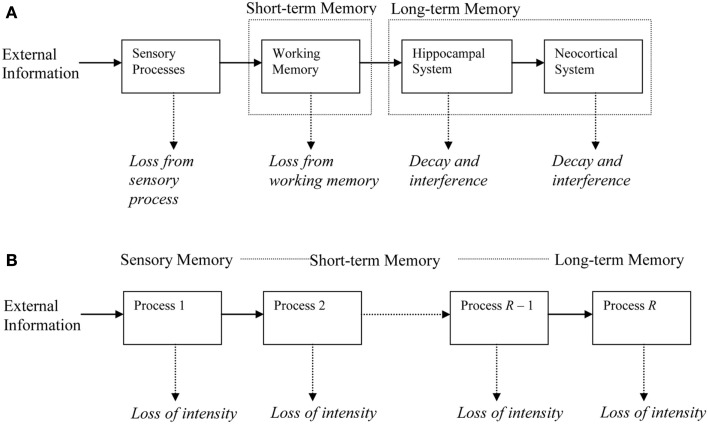
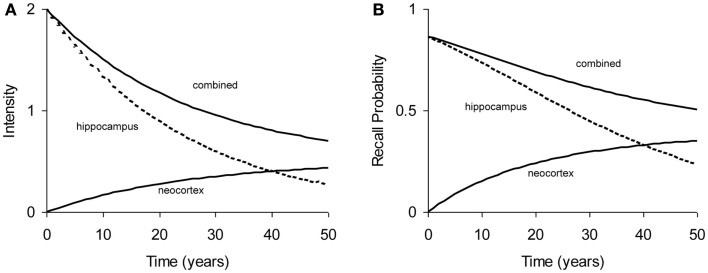
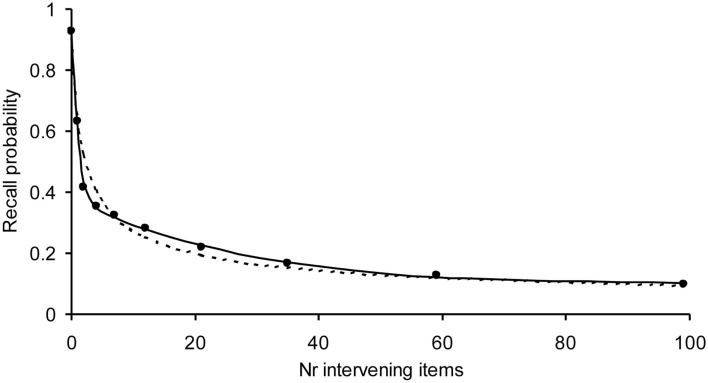
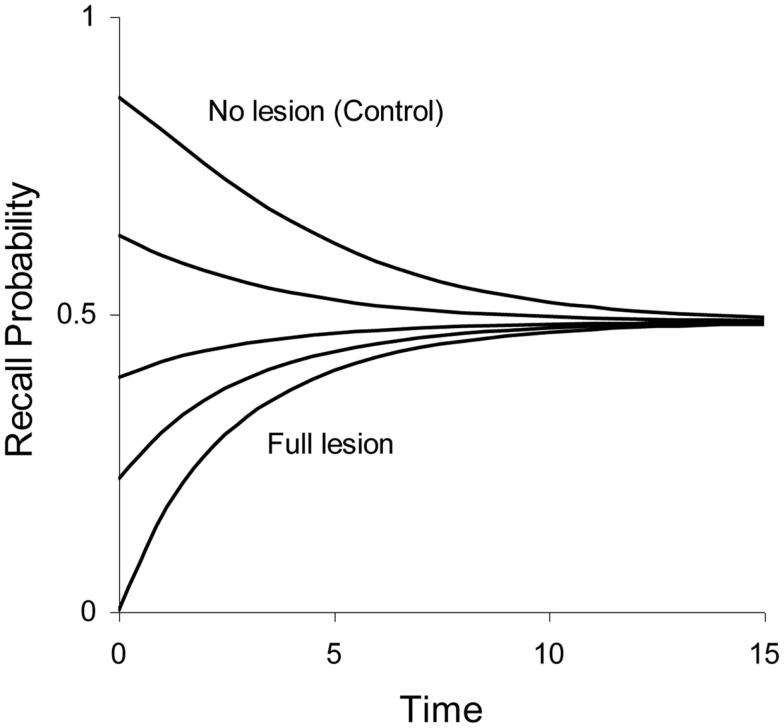
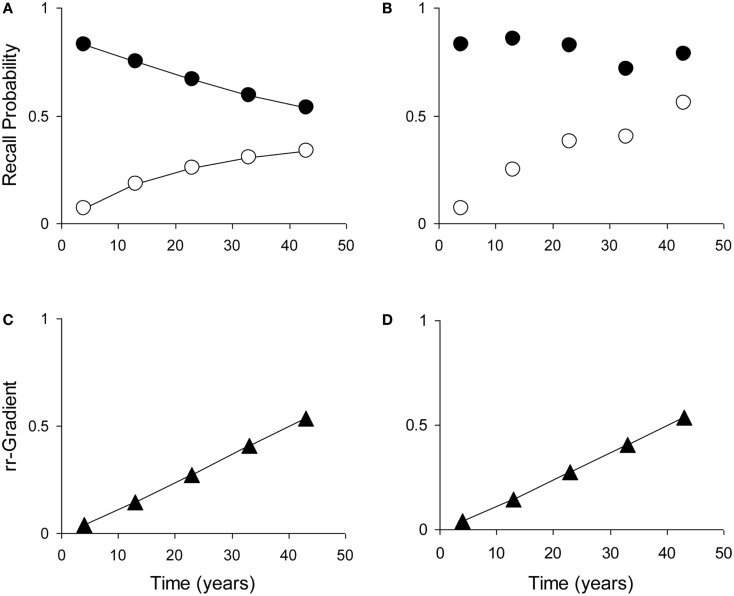
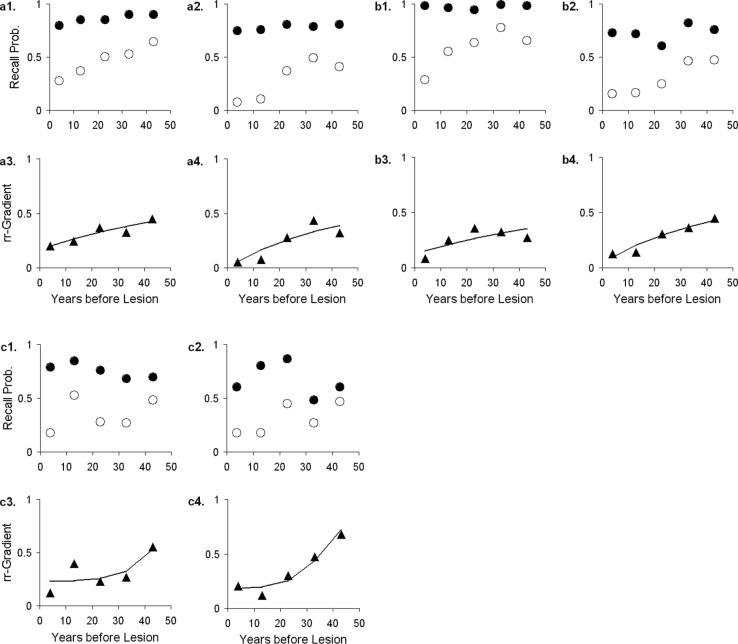
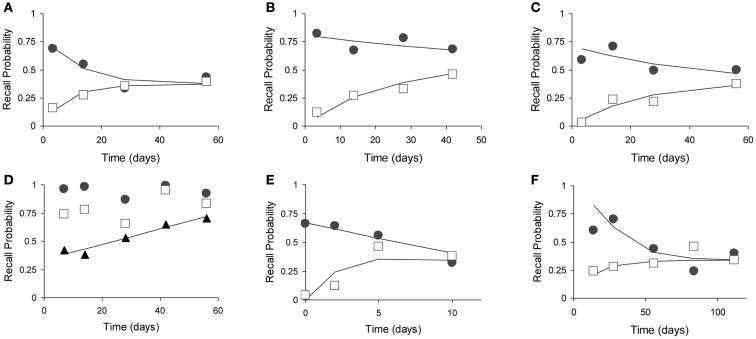
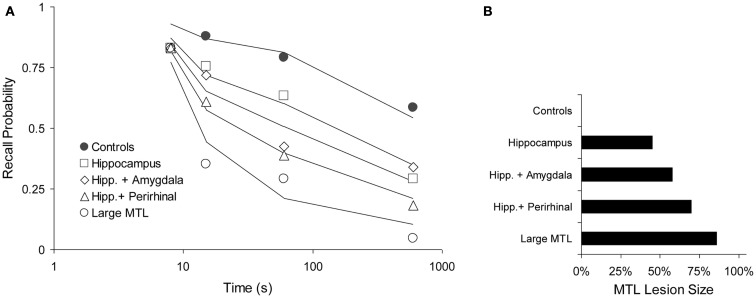
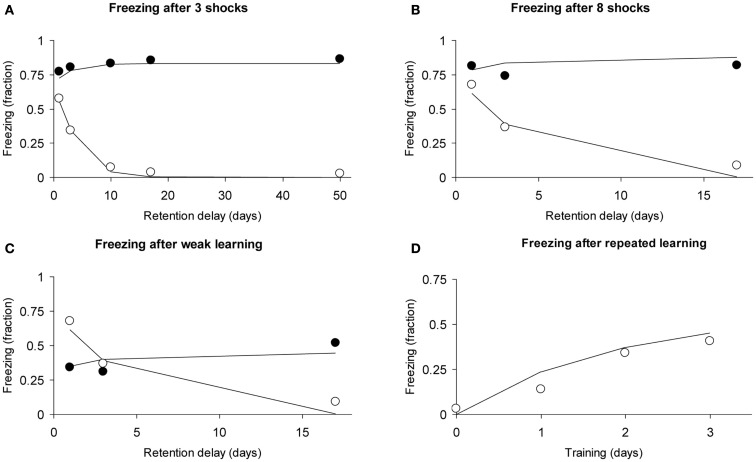
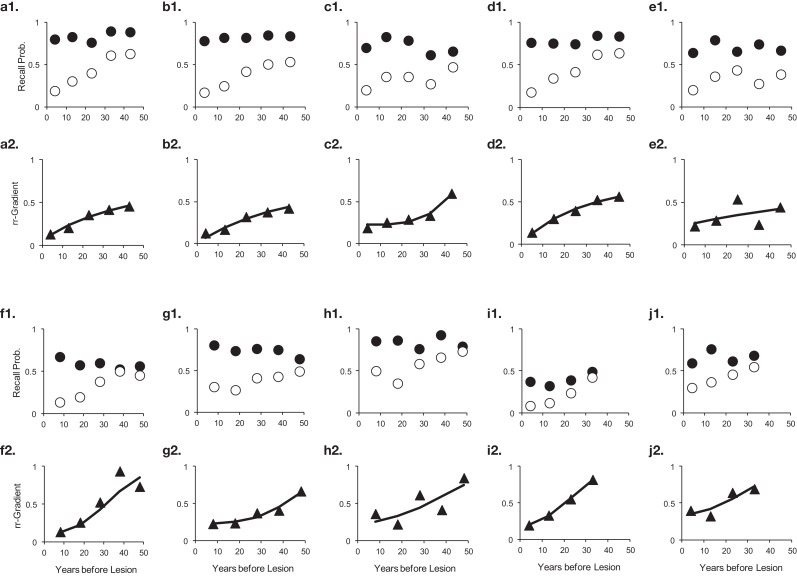
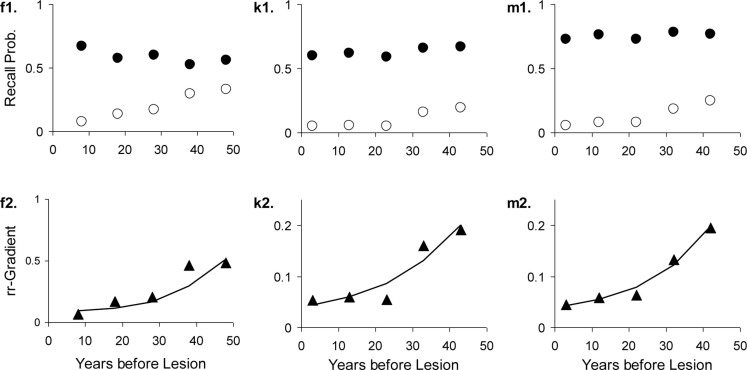
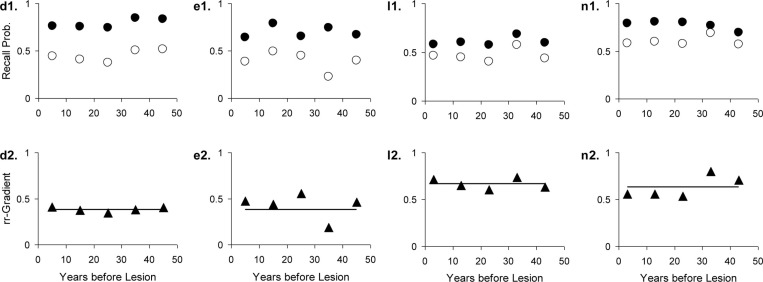
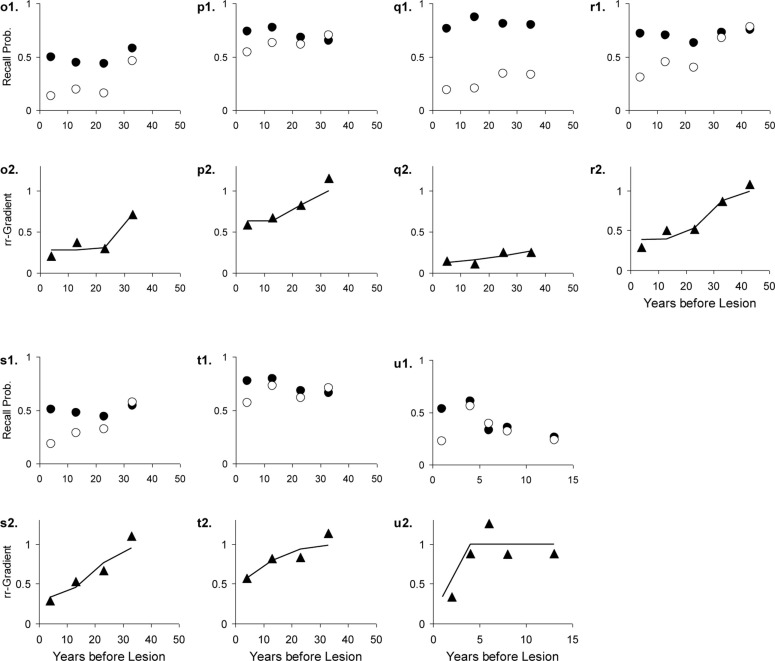
We describe a mathematical model of learning and memory and apply it to the dynamics of forgetting and amnesia. The model is based on the hypothesis that the neural systems involved in memory at different time scales share two fundamental properties: (1) representations in a store decline in strength (2) while trying to induce new representations in higher-level more permanent stores. This paper addresses several types of experimental and clinical phenomena: (i) the temporal gradient of retrograde amnesia (Ribot's Law), (ii) forgetting curves with and without anterograde amnesia, and (iii) learning and forgetting curves with impaired cortical plasticity. Results are in the form of closed-form expressions that are applied to studies with mice, rats, and monkeys. In order to analyze human data in a quantitative manner, we also derive a relative measure of retrograde amnesia that removes the effects of non-equal item difficulty for different time periods commonly found with clinical retrograde amnesia tests. Using these analytical tools, we review studies of temporal gradients in the memory of patients with Korsakoff's Disease, Alzheimer's Dementia, Huntington's Disease, and other disorders.
Keywords: Alzheimer’s disease; Korsakoff’s syndrome; amnesia; consolidation; cortex; forgetting; hippocampus; mathematical modeling.
Figures
Similar articles
-
On Common Ground: Jost's (1897) law of forgetting and Ribot's (1881) law of retrograde amnesia.Psychol Rev. 2004 Oct;111(4):864-79. doi: 10.1037/0033-295X.111.4.864. Psychol Rev. 2004. PMID: 15482065 Review.
-
Temporal gradients in the retrograde amnesia of patients with alcoholic Korsakoff's disease.Arch Neurol. 1979 Apr;36(4):211-6. doi: 10.1001/archneur.1979.00500400065010. Arch Neurol. 1979. PMID: 426664
-
Irrelevant, incidental and core features in the retrograde amnesia associated with Korsakoff's psychosis: a review.Behav Neurol. 1992;5(2):67-74. doi: 10.3233/BEN-1992-5201. Behav Neurol. 1992. PMID: 24487707
-
Retrograde amnesia in Parkinson's disease.Can J Neurol Sci. 1984 May;11(2):297-301. doi: 10.1017/s031716710004556x. Can J Neurol Sci. 1984. PMID: 6234056
-
On remembering and forgetting our autobiographical pasts: retrograde amnesia and Andrew Mayes's contribution to neuropsychological method.Neuropsychologia. 2012 Nov;50(13):2961-72. doi: 10.1016/j.neuropsychologia.2012.07.028. Epub 2012 Aug 2. Neuropsychologia. 2012. PMID: 22884958 Review.
Cited by
-
From Topological Analyses to Functional Modeling: The Case of Hippocampus.Front Comput Neurosci. 2021 Jan 11;14:593166. doi: 10.3389/fncom.2020.593166. eCollection 2020. Front Comput Neurosci. 2021. PMID: 33505262 Free PMC article.
-
Stochastic consolidation of lifelong memory.Sci Rep. 2022 Jul 30;12(1):13107. doi: 10.1038/s41598-022-16407-9. Sci Rep. 2022. PMID: 35907920 Free PMC article.
-
Replays of spatial memories suppress topological fluctuations in cognitive map.Netw Neurosci. 2019 Jul 1;3(3):707-724. doi: 10.1162/netn_a_00076. eCollection 2019. Netw Neurosci. 2019. PMID: 31410375 Free PMC article.
-
Randomly fluctuating neural connections may implement a consolidation mechanism that explains classic memory laws.Sci Rep. 2022 Aug 4;12(1):13423. doi: 10.1038/s41598-022-17639-5. Sci Rep. 2022. PMID: 35927567 Free PMC article.
-
Transient cell assembly networks encode stable spatial memories.Sci Rep. 2017 Jun 21;7(1):3959. doi: 10.1038/s41598-017-03423-3. Sci Rep. 2017. PMID: 28638123 Free PMC article.
References
-
- Abraham W. C., Otani S. (1991). “Macromolecules and the maintenance of long-term potentiation,” in Kindling and Synaptic Plasticity, ed. Morrell F. (Boston: Birkhäuser; ), 92–109
LinkOut - more resources
Full Text Sources
Other Literature Sources