. 2013 Mar;3(3):387-97.
doi: 10.1534/g3.112.004812. Epub 2013 Mar 1.

Accurate identification and analysis of human mRNA isoforms using deep long read sequencing

Affiliations

Accurate identification and analysis of human mRNA isoforms using deep long read sequencing

Hagen Tilgner et al. G3 (Bethesda). 2013 Mar.

Abstract

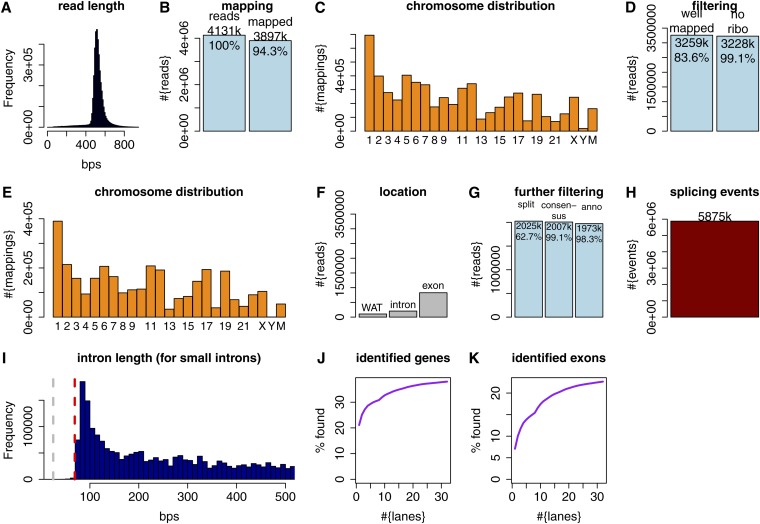
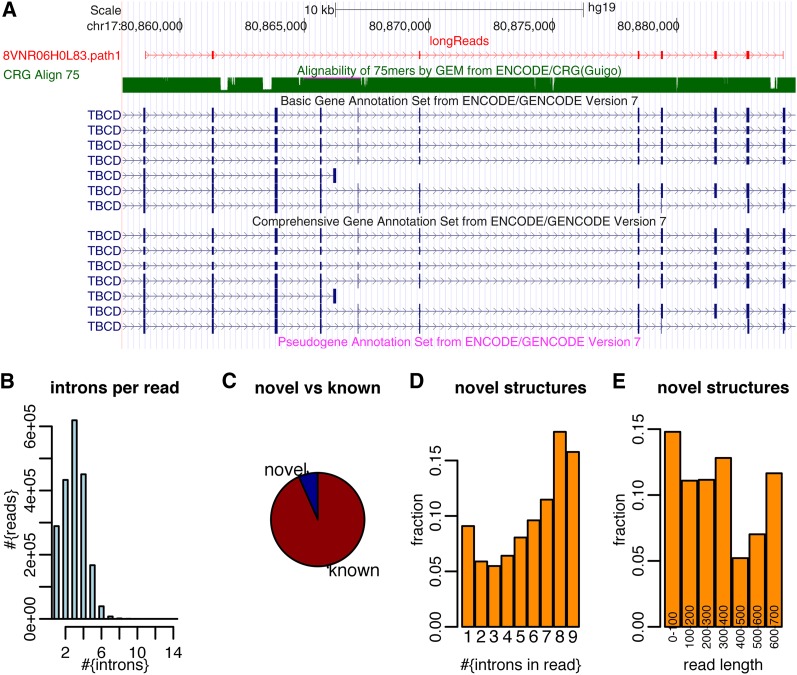
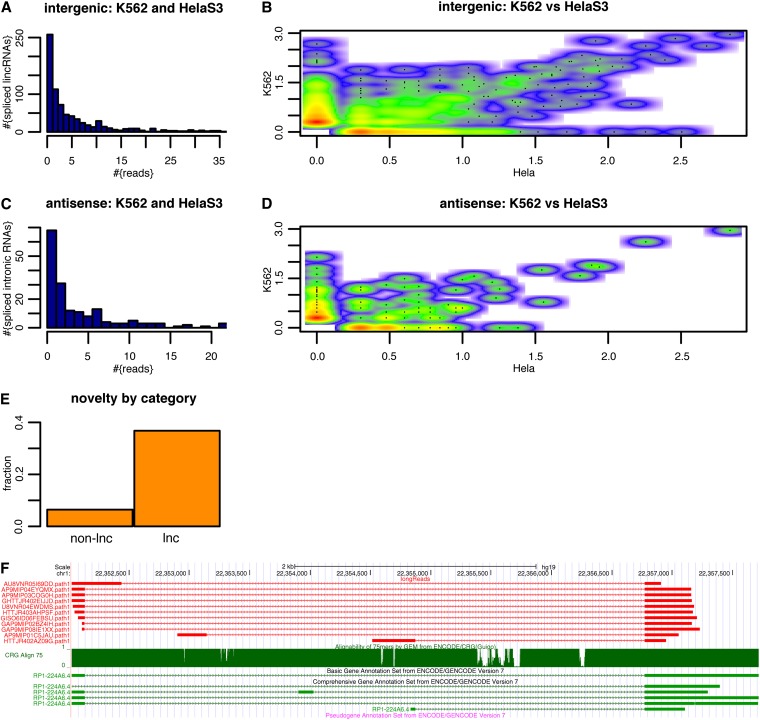
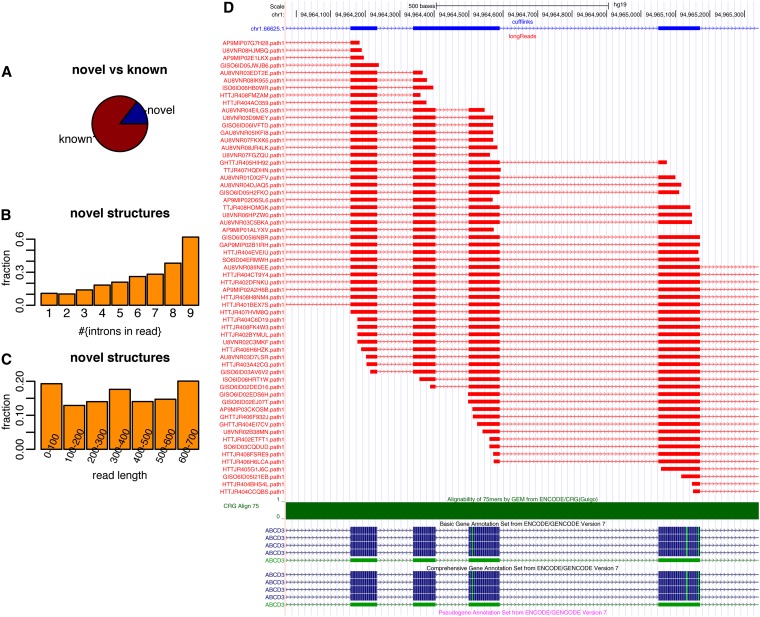
Precise identification of RNA-coding regions and transcriptomes of eukaryotes is a significant problem in biology. Currently, eukaryote transcriptomes are analyzed using deep short-read sequencing experiments of complementary DNAs. The resulting short-reads are then aligned against a genome and annotated junctions to infer biological meaning. Here we use long-read complementary DNA datasets for the analysis of a eukaryotic transcriptome and generate two large datasets in the human K562 and HeLa S3 cell lines. Both data sets comprised at least 4 million reads and had median read lengths greater than 500 bp. We show that annotation-independent alignments of these reads provide partial gene structures that are very much in-line with annotated gene structures, 15% of which have not been obtained in a previous de novo analysis of short reads. For long-noncoding RNAs (i.e., lncRNA) genes, however, we find an increased fraction of novel gene structures among our alignments. Other important aspects of transcriptome analysis, such as the description of cell type-specific splicing, can be performed in an accurate, reliable and completely annotation-free manner, making it ideal for the analysis of transcriptomes of newly sequenced genomes. Furthermore, we demonstrate that long read sequence can be assembled into full-length transcripts with considerable success. Our method is applicable to all long read sequencing technologies.

Keywords: RNA; Roche sequencing; human; splicing; transcriptome.


Figures

Figure 1
Figure 1
(A) Read length histogram for the K562 cell-line. (B) Total number of reads in the K562 cell-line and number (and percentage) of reads that could be mapped using GMAP. Percentages in light blue bars are given with respect to the previous light blue bar. (C) Chromosome distribution of read-mappings. (D) Number of reads (and percentage) that were considered mapped with high confidence (“well-mapped”) and number of reads (and percentage) of reads that did not overlap ribosomal RNA genes. (E) Chromosome distribution of high confidence read mappings that did not overlap ribosomal RNA genes. (F) Number of reads falling entirely into regions without annotated transcription (WAT), intronic, and exonic regions. (G) Number and percentage (with respect to the previous light blue bar) of reads containing a split (first bar); number and percentage of reads containing at least one split and having intron-consensus di-nucleotides at the ends of all splits (second bar); number and percentage of reads containing at least one split and having intron-consensus di-nucleotides at the ends of all splits and having at least one split-end as an annotated splice site for all splits (third bar). (H) Number of introns in these reads (with respect to last blue bar in G). (I) Intron length distribution for the previous introns, showing only introns of up to 500 bps. (J) Percentage of annotated genes identified when using increasing number of reads. (K) Percentage of annotated exons identified when using increasing number of reads.
Figure 2
Figure 2
454-read mappings in the K562 cell-line. (A) Example of a 454 read showing a partial gene structure that was not annotated. (B) Distribution of intron number in aligned reads (with consensus splits). (C) Pie chart of partial gene structures (given by alignments of 454 reads) that (1) correspond to parts of annotated gene structures and (2) those that do not correspond to parts of annotated gene structures. (D) Fraction of reads whose intron structures are not included in annotated gene structures as a function of intron number in the read-alignments. (E) Fraction of reads whose intron structures are not included in annotated gene structures as a function of read-length. Note that there are very few reads that have between 0 and 400 bp.
Figure 3
Figure 3
(A) Histogram of long-read numbers found for intergenic, defined as “between protein coding genes” (see Derrien et al. 2012), lncRNAs combining the reads found in K562 and in HeLa S3. (B) Scatterplot for log10-transformed read numbers in HeLa S3 (x-axis) and K562 (y-axis) of these lncRNAs. Colorscale from white (no lncRNAs) to red (large number of lncRNAs) (C) Same as A but for intronic lncRNAs. (D) Same as for B but for intronic lncRNAs. (E) Fraction of reads mapping to non-lnc genes that represent novel isoforms (left) and fraction of reads mapping to lncRNA genes that represent novel isoforms (right). (F) First (and not cherry-picked) example of 454 reads (top, red) showing novel isoforms for a lncRNA gene (annotated transcripts in green, bottom). The read that led to the choice of this example is the second to the last.
Figure 4
Figure 4
(A) Pie chart (for the K562 cell line) of partial 454 gene structures that (1) correspond to parts of full-length transcript structures predicted using ENCODE short reads and (2) those that do not correspond to parts of these predicted transcript structures. (B) Fraction of reads whose intron-structures are not included in predicted transcript structures (based on ENCODE short reads) as a function of intron number in the read-alignments. (C) Fraction of reads whose intron-structures are not included in predicted transcript structures as a function of read-length. Note that there are very few reads that have between 0 and 400 bp. (D) Example of partial transcript structures given by 454 reads (red) that are not included in predicted cufflinks structures (based on ENCODE short reads from the same cell line, top, blue).
Figure 5
Figure 5
Testing of exons for cell type specific exon inclusion. (A) ΔΨ (i.e., ΨHelaS3 − ΨK562) distribution for exons showing significantly different inclusion levels between the two cell-types. Exons more highly included in the HeLa S3 cell line (blue) and exons more highly included in the K562 cell line (dark red). (B) P-value distribution for exons passing the significance threshold of 0.05. (C) Boxplots of exon length for tested exons not passing the significance threshold (light blue) and for those passing the significance threshold (dark blue/dark red). (D) Bar plot indicating the fraction of exons whose length is a multiple of three for tested exons not passing the significance threshold (light blue) and for those passing the significance threshold (dark blue/dark red). (E) Boxplots of acceptor scores for tested exons not passing the significance threshold (light blue) and for those passing the significance threshold (dark blue/dark red). (F) Boxplots of donor scores for tested exons not passing the significance threshold (light blue) and for those passing the significance threshold (dark blue/dark red). (G) Fraction of cell-type specific alternative exons that are annotated as exons (“known”), and those that are not (“novel”). (H) Fraction of cell-type specific alternative exons that are annotated as alternative exons (“known”), and those that are not (“novel”).
Figure 6
Figure 6
(A) Intron number distribution for short-read-cufflinks transcripts and long-read-cufflinks transcripts. (B) Total number of predicted transcripts for short-read-cufflinks and for long-read-cufflinks. (C) Fraction of predicted transcripts (for short-read-cufflinks and for long-read-cufflinks), for which an annotated transcript with identical introns could be found. (D) Total number of predicted transcripts (for short-read-cufflinks and for long-read-cufflinks), for which an annotated transcript with identical introns could be found. (E) Total number of predicted transcripts with intron-identical annotated transcripts that could be found only by “short-read-cufflinks,” only by “long-read-cufflinks,” or by both. (F) Intron number distribution for intron-identical annotated transcripts that could be found only by “short-read-cufflinks” or only by “long-read-cufflinks.”

References

    1. Benjamini Y., Hochberg Y., 1995. Controlling the false discovery rate: a practical and powerful approach to multiple testing. J. Royal Stat. Soc. B. 57: 289–300
    1. David C. J., Manley J. L., 2010. Alternative pre-mRNA splicing regulation in cancer: pathways and programs unhinged. Genes Dev. 24: 2343–2364 - PMC - PubMed
    1. Derrien T., Johnson R., Bussotti G., Tanzer A., Djebali S., et al. , 2012. The GENCODE v7 catalog of human long noncoding RNAs: analysis of their gene structure, evolution, and expression. Genome Res. 22: 1775–1789 - PMC - PubMed
    1. Djebali S., Davis C. A., Merkel A., Dobin A., Lassmann T., et al. , 2012. Landscape of transcription in human cells. Nature 489: 101–108 - PMC - PubMed
    1. Eid J., Fehr A., Gray J., Luong K., Lyle J., et al. , 2009. Real-time DNA sequencing from single polymerase molecules. Science 323: 133–138 - PubMed

Publication types

MeSH terms