. 2013 Mar;3(3):399-407.
doi: 10.1534/g3.112.005355. Epub 2013 Mar 1.

On the mutational topology of the bacterial genome

Affiliations

On the mutational topology of the bacterial genome

Patricia L Foster et al. G3 (Bethesda). 2013 Mar.

Abstract

By sequencing the genomes of 34 mutation accumulation lines of a mismatch-repair defective strain of Escherichia coli that had undergone a total of 12,750 generations, we identified 1625 spontaneous base-pair substitutions spread across the E. coli genome. These mutations are not distributed at random but, instead, fall into a wave-like spatial pattern that is repeated almost exactly in mirror image in the two separately replicated halves of the bacterial chromosome. The pattern is correlated to genomic features, with mutation densities greatest in regions predicted to have high superhelicity. Superimposed upon this pattern are regional hotspots, some of which are located where replication forks may collide or be blocked. These results suggest that, as they traverse the chromosome, the two replication forks encounter parallel structural features that change the fidelity of DNA replication.

Keywords: DNA polymerase errors; chromosome structure; evolution; mutation rate; replication fidelity.


Figures

Figure 1
Figure 1
The distribution of BPSs across the genome. The 4640-kb E. coli chromosome is shown with the traditional zero point at the top. Each blue line with a red cap indicates the position of a BPS that accumulated in the MutL strain; the thickness of each line is equivalent to approximately one kb, centered on the position of the BPS. OriC, the origin of replication at 3924 kb; TerD, TerA, TerC, and TerB, strong termination sites at 1279 kb, 1340 kb, 1607 kb, and 1682 kb, respectively (Duggin and Bell 2009). Clockwise (rightward) moving forks are halted at TerC or TerB and counterclockwise (leftward) moving forks are halted at TerA or TerD.
Figure 2
Figure 2
The distribution of the gaps between BPSs. Shown are the four quartiles of a quantile-quantile (Q-Q) plot (Rice 1995) of the observed sizes of the intervals (gaps) between BPSs vs. the sizes predicted by an exponential distribution. For this analysis, gaps that contained large repeat elements have been removed (see Materials and Methods); this procedure left 1581 BPSs distributed over 4284 kb of the chromosome, giving a mean gap size of 2.71 kb. The observed distribution is significantly different than expected (χ2 ≈104; p ≪ 0.0001).
Figure 3
Figure 3
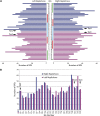
The distribution of binned BPSs across the genome. (A) The 1625 BPSs that accumulated in the MutL strain collected into 46 bins, each bin approximately 100 kb in size, starting at the origin of replication. Each side of the histogram displays the binning in opposite directions, reproducing the movement of the two replication forks as if each continued across the whole chromosome (i.e., the lower left quadrant is the inverted mirror image of the upper right quadrant, and vice versa); the color changes from blue to magenta at the midpoint of the chromosome. The strong termination sites, TerA and TerC, in bins 21 and 24, respectively, are indicated; not indicated are the alternative strong termination sites, TerD in bin 20 and TerB in bin 24. The four MDs defined by the efficiency of recombinational exchange within each domain (Niki et al. 2000; Valens et al. 2004) are indicated: green, Ori MD; cherry, left MD and right MD; cyan, terminal MD. (B) The bins in (A) reoriented so to directly compare the mutational pattern of the two replichores. Note that the Ter sites are not symmetrically oriented with respect to the origin; the midpoint of the chromosome lies between bins 23 and 24, close to TerC. Thus, the peaks in mutational density in bins 20 and 25 surround the terminal region bounded by TerA and TerC, whereas the peak in bin 27 is well outside of this region.
Figure 4
Figure 4
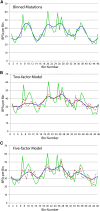
Wavelet transformations of the mutational distribution. (A) The numbers of BPSs in each of 46 bins are plotted in green with the bins arranged proceeding clockwise across the chromosome starting and ending at the origin of replication (OriC). The Daubechies wavelet transform is plotted in blue. (B) Two-factor model. A linear regression of the number of mutations against 10 chromosomal features significantly correlated with the mutational data (see Table S3) produced an optimal two-factor model. The model is: mutations = 16 + (7.8 × HU) + (1.5 × FIS), where HU indicates the HU response per gene minus hupAB and FIS indicates the number of genes up-regulated in a Fis mutant (see Table 1). For this model, r2 = 0.335, p = 0.0002. The numbers of mutations per bin predicted by this model (dashed, magenta) and the corresponding Daubechies wavelet transform curve (blue) are compared to the observed numbers of mutations per bin (green). (C) Five-factor model. To produce the five factor model, a linear regression of the number of mutations was performed against the ten features that were used to generate the two-factor model plus seven additional features that had positive or negative correlation coefficients with the mutational data of ≈ 0.2 (see Table S3). The model is: mutations = 68 – (97 × CAI) + (5.0 × HU) + (1.0 × FIS) + (0.9 × RR) – (0.8 × H-NS), where HU and FIS are defined as previously; CAI indicates the average gene CAI; H-NS indicates the number of genes down-regulated in an H-NS mutant; and RR indicates the number of relaxation repressed genes. For this model, r2 = 0.435, p = 0.0003. The numbers of mutations per bin predicted by this model (dashed, magenta) and the corresponding Daubechies wavelet transform curve (blue) are compared to the observed numbers of mutations per bin (green).
Figure 5
Figure 5
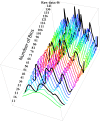
The stability of wavelet transform against changes in bin size. Daubechies wavelet transforms were applied to the binned data with the number of bins per chromosome varying from 11 to 141 (corresponding to bin sizes of 422 kb to 33 kb), resulting in the curves plotted here. Black lines indicate 21, 46, and 91 bins, with the terminal black line indicating the raw, untransformed 46-bin data.

References

    1. Agier N., Fischer G., 2012. The mutational profile of the yeast genome is shaped by replication. Mol. Biol. Evol. 29: 905–913 - PubMed
    1. Akaike H., 1973. Information theory and the extension of the maximum likelihood principle, pp. 267–281 in Second International Symposium on Information Theory, edited by Petrov V. N., Csaki F. Academiai Kiadó, Budapest
    1. Allen T. E., Herrgard M. J., Liu M., Qiu Y., Glasner J. D., et al. , 2003. Genome-scale analysis of the uses of the Escherichia coli genome: model-driven analysis of heterogeneous data sets. J. Bacteriol. 185: 6392–6399 - PMC - PubMed
    1. Allen T. E., Price N. D., Joyce A. R., Palsson B. O., 2006. Long-range periodic patterns in microbial genomes indicate significant multi-scale chromosomal organization. PLOS Comput. Biol. 2: e2. - PMC - PubMed
    1. Benzer S., 1961. On the topography of the genetic fine structure. Proc. Natl. Acad. Sci. USA 47: 403–415 - PMC - PubMed

Publication types