. 2013;8(2):e57141.
doi: 10.1371/journal.pone.0057141. Epub 2013 Feb 22.

Early activation of rat skeletal muscle IL-6/STAT1/STAT3 dependent gene expression in resistance exercise linked to hypertrophy

Affiliations

Early activation of rat skeletal muscle IL-6/STAT1/STAT3 dependent gene expression in resistance exercise linked to hypertrophy

Gwénaëlle Begue et al. PLoS One. 2013.

Abstract

Cytokine interleukin-6 (IL-6) is an essential regulator of satellite cell-mediated hypertrophic muscle growth through the transcription factor signal transducer and activator of transcription 3 (STAT3). The importance of this pathway linked to the modulation of myogenic regulatory factors expression in rat skeletal muscle undergoing hypertrophy following resistance exercise, has not been investigated. In this study, the phosphorylation and nuclear localization of STAT3, together with IL-6/STAT3-responsive gene expression, were measured after both a single bout of resistance exercise and 10 weeks of training. Flexor Digitorum Profundus muscle samples from Wistar rats were obtained 2 and 6 hours after a single bout of resistance exercise and 72 h after the last bout of either 2, 4, or 10 weeks of resistance training. We observed an increase in IL-6 and SOCS3 mRNAs concomitant with phosphorylation of STAT1 and STAT3 after 2 and 6 hours of a single bout of exercise (p<0.05). STAT3-dependent early responsive genes such as CyclinD1 and cMyc were also upregulated whereas MyoD and Myf5 mRNAs were downregulated (p<0.05). BrdU-positive satellite cells increased at 2 and 6 hours after exercise (p<0.05). Muscle fiber hypertrophy reached up to 100% after 10 weeks of training and the mRNA expression of Myf5, c-Myc and Cyclin-D1 decreased, whereas IL-6 mRNA remained upregulated. We conclude that the IL-6/STAT1/STAT3 signaling pathway and its responsive genes after a single bout of resistance exercise are an important event regulating the SC pool and behavior involved in muscle hypertrophy after ten weeks of training in rat skeletal muscle.


Conflict of interest statement

Competing Interests: The authors have declared that no competing interests exist.

Figures

Figure 1
Figure 1. STAT3 activity in rat skeletal muscle following acute resistance exercise.
(1a) Representative western blot from FDP muscle protein samples taken at REST, 2 hours (E2H), 6 hours (E6H) post-exercise and after 10 weeks of training (CTL10, TR10), with anti-phospho-STAT3 (Tyr705) (pSTAT3), anti-total STAT3 (tSTAT3) and anti-α-tubulin. The arrow indicates the pSTAT3 band at 79 kDa and α-tubulin at 55 kDa. Graph shows arbitrary units of pSTAT3 normalized to tSTAT3 representing the mean ± SEM of 4–6 rats * significantly different from REST (p<0.05); † significantly different from CTL10 (p<0.01). (1b) Representative merged image of E2H at 40× magnification with inset box showing (b-i) nuclei (Hoestch = blue), (b-ii) satellite cells (red = Pax7+ indicated by arrow), (b-iii) pSTAT3 protein (green = pSTAT3 indicated by arrowhead), (b-iiii) Pax7+/pSTAT3+ cell at 2 h (E2H). Note: No Pax7+/pSTAT3+ staining found at REST, E6H, CTL10 or TR10 (not shown).
Figure 2
Figure 2. STAT1 activity in rat skeletal muscle following acute resistance exercise.
A: representative western blot of protein extracted from FDP muscle samples taken at REST, 2 hours (E2H), 6 hours (E6H) post-exercise and after 10 weeks of training (CTL10, TR10), with anti-phospho-STAT1 (Tyr701) (pSTAT1), anti-total STAT1 (tSTAT1) and anti-α-tubulin. The arrow indicates the pSTAT1 band at 91 kDa. and α-tubulin at 55 kDa. B: The graph shows arbitrary units of pSTAT1 normalized to tSTAT1 representing the mean ± SEM of 4–6 rats. * Significantly different from resting value (REST; p<0.05). † Significantly different from E2H (p<0.01). ‡ Significantly different from E6H (p<0.01).
Figure 3
Figure 3. Erk1/2 activity in rat skeletal muscle following acute resistance exercise.
A: representative western blots of protein extracted from FDP muscle samples taken at REST, 2 hours (E2H) and 6 hours (E6H) after acute resistance exercise or after 10 weeks of resistance training (TR10) or rest (CTL10), with anti-phospho-Erk1/2 (Tyr202/204) (pErk1/2), anti-total Erk1/2 (tErk1/2) and α-tubulin. The arrow indicates the pErk1/2 bands at 42/44 kDa and α-tubulin at 55 kDa. B: The graph shows arbitrary units of pErk1/2 normalized to tErk1/2 representing the mean ± SEM of 4–6 rats. * Significantly different from resting value (p<0.05).
Figure 4
Figure 4. Satellite cell proliferation following acute resistance exercise.
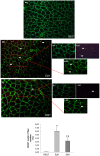
A–C: Representative merged image (×20 magnification) of laminin staining (green) and BrdU-positive cells (red) of FDP muscle taken at REST (A), E2H (B), and E6H (C). b–c: Inset box (×40 magnification) of (i) laminin (green), (ii) BrdU (red), (iii) BrdU-positive satellite cells (merged image). D: The graph shows the mean ±SEM of BrdU-positive satellite cells (%) expressed per 2000 fibers of 4 rats. * Significantly different from REST (p<0.05). † Significantly different from E2H (p<0.05).
Figure 5
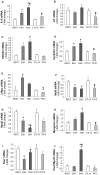
Figure 5. IL-6 (A), LIF (B), SOCS3 (C), CyclinD1 (D), c-Myc (E), Myf5 (F), MyoD (G), Myogenin (H), Pax7 (I), Pax7/MyoD (J) gene expressions.
mRNA expressions 2 hours (E2H) and 6 hours (E6H) after a single bout of resistance exercise and 72 hours after 10 weeks of strength training program (CTL10, TR10) in FDP skeletal muscle of rats. Values are means of mRNA-fold change from REST or CTL10 ±SEM, n = 4–6 rats. * Significantly different from Rest (p<0.05). † Significantly different from E2H (p<0.05). ‡ Significantly different from CTL10 (p<0.05).
Figure 6
Figure 6. Involvement of IL-6/JAK/STAT pathway upon satellite cells behavior after resistance exercise and training.
1. In response to increase workload, the SRF mediated IL-6 increasing production leads to satellite cells proliferation and first preferentially activate the JAK1/STAT1/STAT3 pathway leading to the rebuilt of the Pax7(+)/MyoD(−) pool. Like the Notch activity for the maintenance of the Pax7(+) SCs, the mitogen activated protein kinase Erk1/2 cooperates with the JAK1/STAT1/STAT3 pathway to repress early myogenic differentiation. 2. Later, the decreased Notch activity, the activation of the JAK2/STAT2/STAT3 together with multiple pro-differentiating factors (p38, Calcineurin, IGF-1…) activate SCs which loose the Pax7 expression (Pax7(−)/MyoD(+)) and start to differentiate. At this stage, SCs express late MRFs (Myf5, Myogenin) and then fuse to existing myocytes leading to hypertrophy.

References

    1. Abernethy PJ, Jurimae J, Logan PA, Taylor AW, Thayer RE (1994) Acute and chronic response of skeletal muscle to resistance exercise. Sports Med 17: 22–38. - PubMed
    1. Mauro A (1961) Satellite cell of skeletal muscle fibers. J Biophys Biochem Cytol 9: 493–495. - PMC - PubMed
    1. Rosenblatt JD, Yong D, Parry DJ (1994) Satellite cell activity is required for hypertrophy of overloaded adult rat muscle. Muscle Nerve 17: 608–613. - PubMed
    1. Schultz E (1989) Satellite cell behavior during skeletal muscle growth and regeneration. Med Sci Sports Exerc 21: S181–186. - PubMed
    1. Parker PJ, Evans MJ, Annan IH (1999) Catastrophic familial rhabdomyolysis: compartment syndrome with muscle fiber regeneration. J Pediatr Orthop B 8: 64–66. - PubMed

Publication types

MeSH terms