. 2013;8(2):e57793.
doi: 10.1371/journal.pone.0057793. Epub 2013 Feb 25.

Deltex-1 activates mitotic signaling and proliferation and increases the clonogenic and invasive potential of U373 and LN18 glioblastoma cells and correlates with patient survival

Affiliations

Deltex-1 activates mitotic signaling and proliferation and increases the clonogenic and invasive potential of U373 and LN18 glioblastoma cells and correlates with patient survival

Roland M Huber et al. PLoS One. 2013.

Abstract

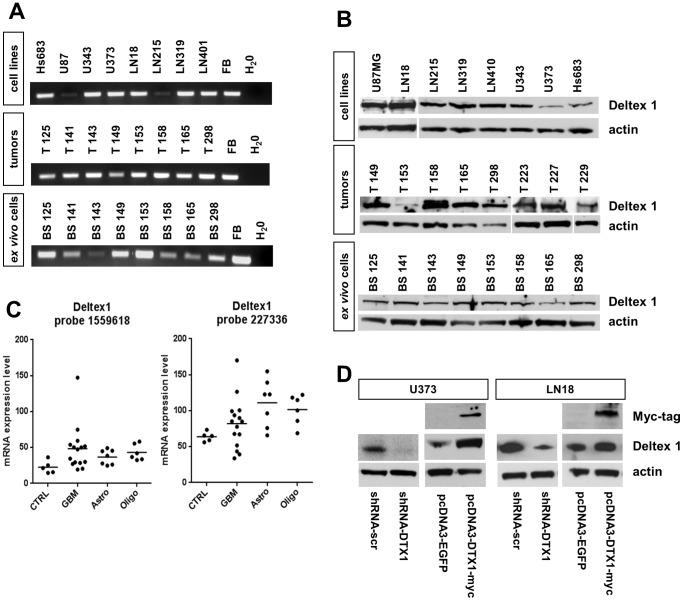
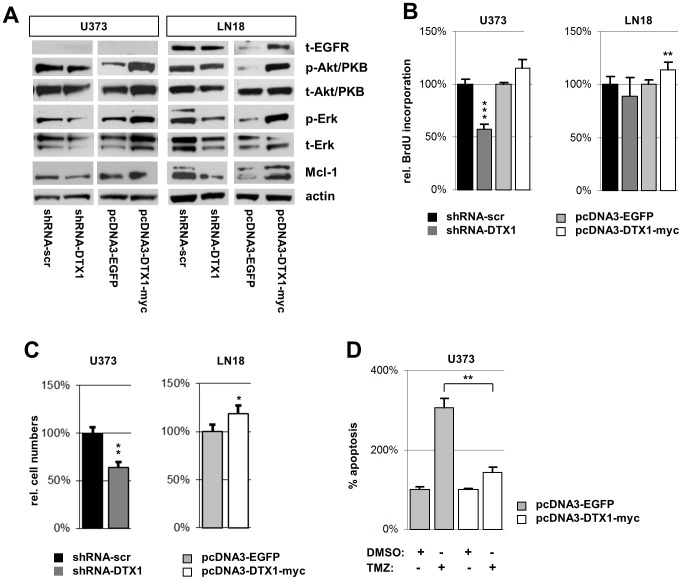
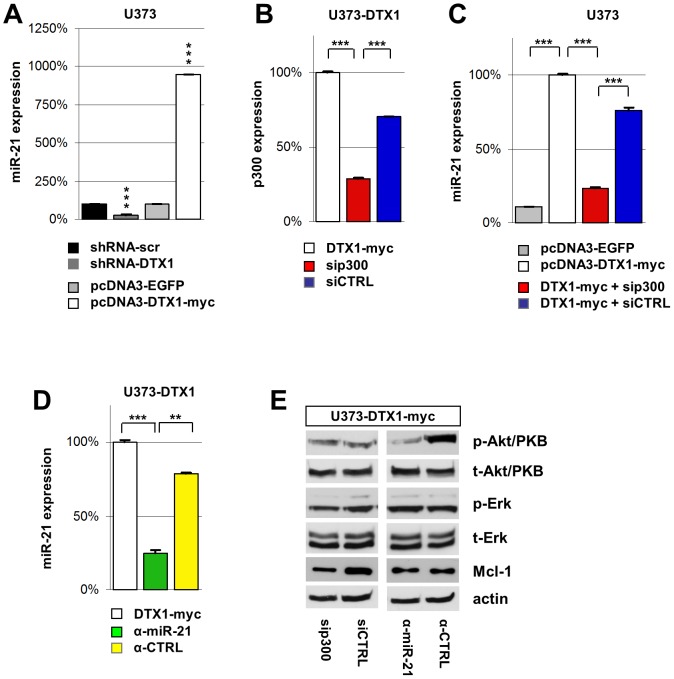
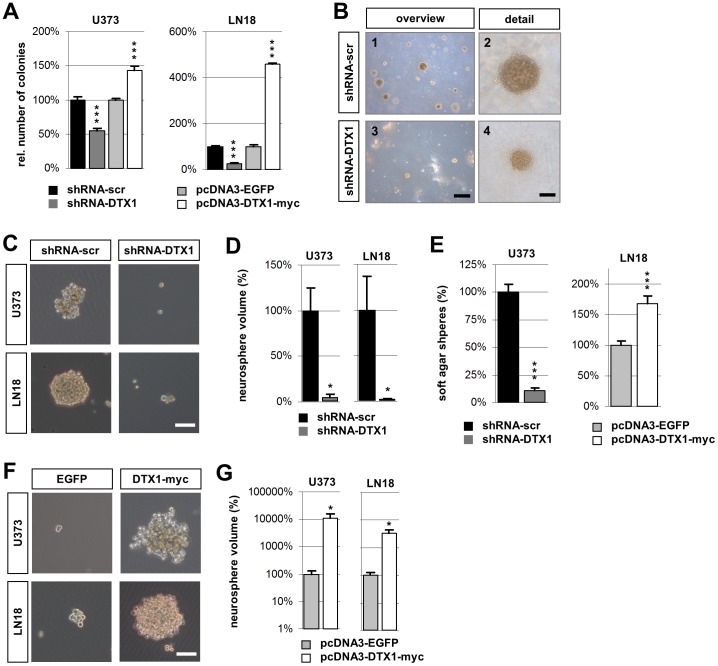
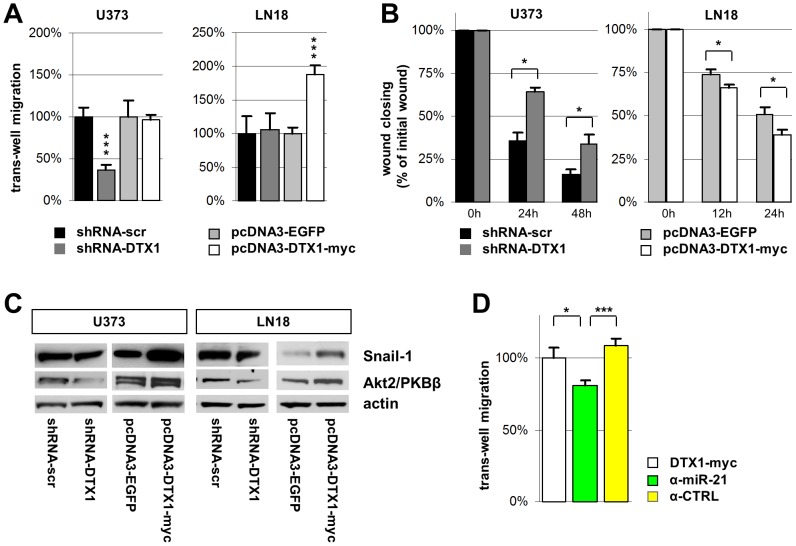
Glioblastoma (GBM) is a highly malignant primary tumor of the central nervous system originating in glial cells. GBM results in more years of life lost than any other cancer type. Low levels of Notch receptor expression correlates with prolonged survival in various high grade gliomas independent of other markers. Different downstream pathways of Notch receptors have been identified. We tested if the Notch/Deltex pathway, which is distinct from the canonical, CSL-mediated pathway, has a role in GBM. We show that the alternative or non-canonical Notch pathway functioning through Deltex1 (DTX1) mediates key features of glioblastoma cell aggressiveness. For example, DTX1 activates the RTK/PI3K/PKB and the MAPK/ERK mitotic pathways and induces anti-apoptotic Mcl-1. The clonogenic and growth potential of established glioma cells correlated with DTX1 levels. Microarray gene expression analysis further identified a DTX1-specific, MAML1-independent transcriptional program - including microRNA-21- which is functionally linked to the changes in tumor cell aggressiveness. Over-expression of DTX1 increased cell migration and invasion correlating to ERK activation, miR-21 levels and endogenous Notch levels. In contrast to high and intermediate expressors, patients with low DTX1 levels have a more favorable prognosis. The alternative Notch pathway via DTX1 appears to be an oncogenic factor in glioblastoma and these findings offer new potential therapeutic targets.


Conflict of interest statement

Competing Interests: The authors have declared that no competing interests exist.

Figures

Figure 1
Figure 1. DTX1 is expressed in glioblastomas, ex vivo cells and established glioma derived cell lines.
(A) Semi-quantitative RT-PCR probing for exon 1 of DTX1 in established glioma derived cell lines, glioma tumor biopsies and ex vivo cell lines. Ex vivo cell lines were derived from tumor biopsies as indicated by the numbering and were maintained as low passage cultures. Fetal brain (FB) was used as positive control. (B) Western Blot analysis of glioma derived cell lines, glioma tumor biopsies and ex vivo cell lines probing for DTX1 and β-actin. (C) Microarray gene expression analysis of tumors and control tissue. Two non-diseased normal brain samples and three normal human astrocyte cultures were used as controls (ctrl), 15 GBMs, seven astrocytomas and six oligodendrogliomas were analyzed. Dots represent individual specimens, average expression values are shown as lines. Results for two independent probes on the chip detecting DTX1 mRNA are shown. (D) Western blot analysis of transfected cell lines U373 and LN18 probing for DTX1, Myc-tag and β-actin demonstrating DTX1 over-expression and down regulation as indicated according to the genotype.
Figure 2
Figure 2. Proliferation and mitotic signaling pathways are modified by DTX1 in established glioma cell lines.
(A) Western blot analysis of signaling cascade proteins. Blots for total EGFR (t-EGFR), phosphorylated Akt/PKB (p-Akt/PKB), total Akt/PKB (t-Akt/PKB), phosphorylated Erk (p-Erk), total Erk (t-Erk), Mcl-1 and β-actin (actin) are shown. (B) Proliferation analysis by BrdU incorporation assay. Relative average values of 5 individual experiments are shown per genotype. (C) Proliferation analysis by cell counting. Equal numbers of cells were seeded, grown for 3d under standard conditions and counted afterwards. (D) Apoptosis in U373 cells after treatment with 100 µM temozolomide (TMZ) or DMSO control. Relative values of sub-G1 cells measured by PI staining are shown normalized to control cells treated with vector control. Averages of at least three independent experiments are shown. Values are normalized to controls. Error bars: ±SEM. * p<0.05, ** p<0.01, *** p<0.001.
Figure 3
Figure 3. DTX1 controls miR-21 expression in a p300 dependent manner.
(A) Real time quantitative PCR analysis of miR-21 expression in U373 cells with modified DTX1 levels. (B) p300 and (C) miR-21 expression levels in U373-DTX1-myc cells transfected with siRNA targeting p300 (sip300, red) or control siRNA (siCTRL, blue) analyzed by qPCR normalized to U373-DTX1-myc. (D) miR-21 expression in U373-DTX1-myc cells treated with miR-21 inhibitor (α-miR-21, green) or an inhibitor control (α-CTRL, yellow). Average relative expression values of at least four independent experiments are shown. Error bars: ±SEM. * p<0.05, ** p<0.01, *** p<0.001. (E) Western blot analysis of signaling cascades in U373-DTX1-myc cells transfected with sip300 or siCTRL. Blots were probed for phosphorylated and total Akt/PKB, phosphorylated and total Erk, Mcl-1 and actin.
Figure 4
Figure 4. DTX1 regulates the clonogenic capacity of U373 and LN18 glioma cells.
(A) Quantification of colonies formed in low density seeding assay after 21d. All colonies were included irrespective of size. Values were normalized to the control cell line. (B) Soft agar colony formation assay shown as light microscopic overview images (1, 3) or detailed close up images (2, 4) of a representative individual colony showing surface independent growth in 0.3% agar. Scale bars: overview 400 µm; detailed view 80 µm. (C) Floating cancer spheres of control (left) or DTX1 down regulated (right) cells grown in NBE medium for 24 days shown as light microscopic images. (D) Relative average volume of neurospheres shown in (C). (E) Quantitative analysis of the number of colonies formed after 15d of incubation in soft agar shown in (B). (F) Floating cancer spheres of control (left) or DTX1 over expressing cells (right) grown in NBE medium for 5 days shown as light microscopic images. (G) Relative average volume of neurospheres shown in (F). Scale bars (C, F): 150 µm. Average values are shown. Error bars: ±SEM. *p<0.05, *** p<0.001.
Figure 5
Figure 5. Migration and invasion potential of glioma cells is regulated by DTX1.
(A) Boyden chamber trans-well migration and invasion assay with U373 and LN18 glioma cells on collagen coated membranes with 8 µm porosity. Counts were performed after 24h. (B) Scratch test wound healing assay. A scratch wound was inflicted and immediately imaged (time 0h). Follow up images were taken after 12, 24 and 48 hours. Wound closing was assessed using standard imaging software. (C) Western blot analysis of known pro-migratory factors in glioblastoma probing for Snail-1, Akt2/PKBβ, and beta-actin. (D) Boyden chamber trans-well migration assay with U373-DTX1-myc cells not treated (white), treated with a miR-21 inhibitor (α-miR-21, green) or an inhibitor control (α-CTRL , yellow). Average values are shown from at least three individual experiments. Error bars: ±SEM. * p<0.05, *** p<0.001.

References

    1. Stupp R, Weber DC (2005) The role of radio- and chemotherapy in glioblastoma. Onkologie 28: 315–317. - PubMed
    1. Burnet NG, Jefferies SJ, Benson RJ, Hunt DP, Treasure FP (2005) Years of life lost (YLL) from cancer is an important measure of population burden--and should be considered when allocating research funds. Br J Cancer 92: 241–245. - PMC - PubMed
    1. Dotto GP (2009) Crosstalk of Notch with p53 and p63 in cancer growth control. Nat Rev Cancer 9: 587–595. - PMC - PubMed
    1. Purow BW, Haque RM, Noel MW, Su Q, Burdick MJ, et al. (2005) Expression of Notch-1 and its ligands, Delta-like-1 and Jagged-1, is critical for glioma cell survival and proliferation. Cancer Res 65: 2353–2363. - PubMed
    1. Zhang X, Chen T, Zhang J, Mao Q, Li S, et al... (2011) Notch1 promotes glioma cell migration and invasion by stimulating beta-catenin and NF-kappaB signaling via AKT activation. Cancer Sci. - PubMed

Publication types

MeSH terms