Review
. 2013:42:337-59.
doi: 10.1146/annurev-biophys-083012-130358. Epub 2013 Feb 28.

Quantitative modeling of bacterial chemotaxis: signal amplification and accurate adaptation

Affiliations
Review

Quantitative modeling of bacterial chemotaxis: signal amplification and accurate adaptation

Yuhai Tu. Annu Rev Biophys. 2013.

Abstract

We review the recent developments in understanding the bacterial chemotaxis signaling pathway by using quantitative modeling methods. The models developed are based on structural information of the signaling complex and the dynamics of the underlying biochemical network. We focus on two important functions of the bacterial chemotaxis signaling pathway: signal amplification and adaptation. We describe in detail the structure and the dynamics of the mathematical models and how they compare with existing experiments, emphasizing the predictability of the models. Finally, we outline future directions for developing the modeling approach to better understand the bacterial chemosensory system.


Figures
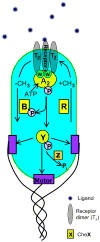
Figure 1
Figure 1
Illustration of the E. coli chemotaxis signaling pathway.
Figure 2
Figure 2
The relative free energy levels of the four states of a receptor dimer.
Figure 3
Figure 3
The difference between the MWC-type model and the Ising-type model. In the MWC model, receptors within a functional cluster (shaded) are synchronized, while those from different functional clusters are independent of each other. In the Ising model, receptors are coupled through nearest neighbor couplings.
Figure 4
Figure 4
The response curves for 6 CheRB-mutant strains as measured by the FRET experiments (symbols, from ref. (47)) and computed from an Ising-type model for mixed receptor clusters (lines, from ref. (30)). The fixed methylation levels of the Tar and Tsr receptors for the 6 different mutant strains are given in the shaded legend box.
Figure 5
Figure 5
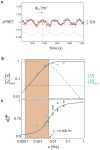
The receptor adaptation dynamics. (a) Illustration of the adaptation process. A sudden change in stimulus induces a quick and strong response from state A to B. Over longer time, the response curve shifts to higher attractant concentration as the system adapts until it reaches the adapted state C with the same activity as the pre-stimulus state A. More importantly, the adapted state C in the new environment has the same high response sensitivity as that of state A. The corresponding time series of the activity is shown in the right panel. (b) The response curves for cells that are pre-adapted to different backgrounds [L]0. The symbols are experimental data (47) and the lines are from a MWC model with adaptation (33).
Figure 6
Figure 6
Illustration of receptor adaptation models. (a) A microscopic model where only active (inactive) receptor demethylates (methylates) as represented by the blue arrows. The receptor activity, which is determined by the ratio of the activation and deactivation rates represented by the red and green arrows respectively, is higher for higher methylation level. The receptor activity also depends on the attractant concentration, which decreases (increases) the activation (deactivation) rate. (b) A coarse-grained model abstracted from the microscopic model shown in (a). The input [L] suppresses the output a, which suppresses the controller (or memory) m, which enhances the output.
Figure 7
Figure 7
The responses to exponential ramps (regenerated from Fig. 2&3 in ref. (43)). (a) An exponential ramp induces a shift in the steady-state activity away from a0. (b) The steady-state activity ac for different ramp rate r. The inset shows the linear regime near a = a0. (c) The functional form of the methylation rate function is determined by using the relation r = αF(ac).
Figure 8
Figure 8
The responses to oscillatory signals (regenerated from Fig. 4 in ref. (43)). (a) The measured response to an oscillatory signal is measured by its amplitude |A| and phase shift φ. (b) The dependence of |A| (upper panel) and φ (lower panel) on the frequency of the signal ν. For ννm, |A|ν and φπ/2, which means that system computes time derivative of the signal. This is confirmed by looking at HA/(), whose amplitude (the green line in the upper panel) is roughly constant for ννm.

References

    1. Adler J, Tso WW. Desicion-making in bacteria: chemotactic response of E. coli to conflicting stimuli. Science. 1976;184:1292–1294. - PubMed
    1. Alon U, Surette MG, Barkai N, Leibler S. Robustness in bachterial chemotaxis. Nature. 1999;397:168–171. - PubMed
    1. Ames P, Studdert CA, Reiser RH, Parkinson JS. Collaborative signaling by mixed chemoreceptor teams in E. coli. Proc Natl Acad Sci USA. 2002;99(10):7060–7065. - PMC - PubMed
    1. Barkai N, Leibler S. Robustness in simple biochemical networks. Nature. 1997;387:913–917. First model to explain accurate robust adaptation in E. coli chemo-taxis. - PubMed
    1. Berg HC, Brown DA. Chemotaxis in E. coli analysed by Three dimensional Tracking. Nature. 1972;239(5374):500–504. - PubMed

Publication types

Substances

LinkOut - more resources