

Refining physician quality indicators for screening mammography in older women: distinguishing appropriate use from overuse
- PMID: 23452077
- PMCID: PMC3602404
- DOI: 10.1111/jgs.12151
Refining physician quality indicators for screening mammography in older women: distinguishing appropriate use from overuse
Abstract
Objectives: To assess the feasibility of refining physician quality indicators of screening mammography use based on patient life expectancy.
Design: Retrospective population-based cohort study.
Setting: Texas.
Participants: Three thousand five hundred ninety-five usual care providers (UCPs) with at least 10 female patients aged 67 and older on January 1, 2008, with an estimated life expectancy of 7 years or more (222,584 women) and at least 10 women with an estimated life expectancy of less than 7 years (90,903 women), based on age and comorbidity.
Measurements: Screening mammography use in 2008-09 by each provider in each population.
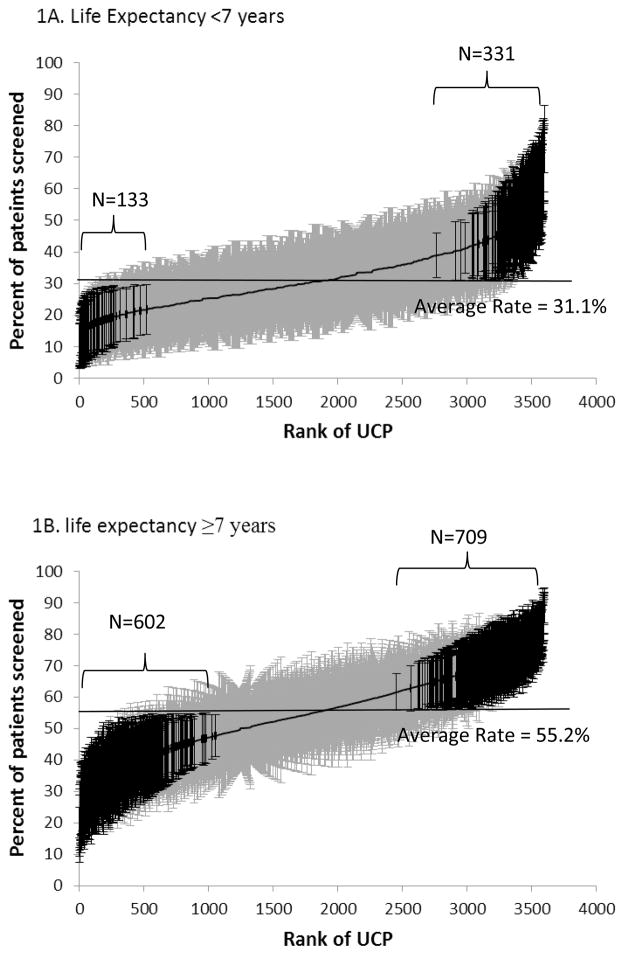
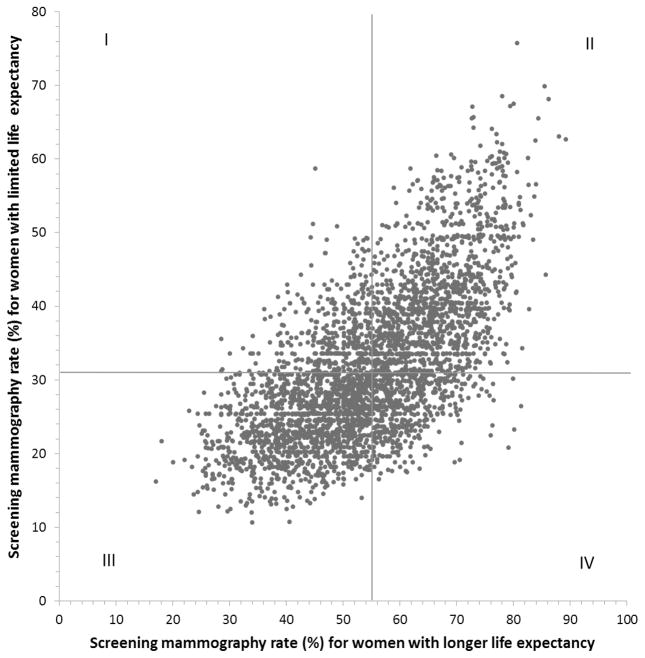
Results: The average adjusted mammography screening rates for UCPs were 31.1% for women with a life expectancy of less than 7 years and 55.2% for women with a life expectancy of 7 years or longer. For women with limited life expectancy, 3.7% of UCPs had significantly lower and 9.2% had significantly higher than average adjusted mammography screening rates. For women with longer life expectancy, 16.7% of UCPs had significantly lower and 19.7% had significantly higher than average rates. UCP adjusted screening rates were stable over time (2006-07 vs 2008-09, correlation coefficient (r) = 0.65, P < .001). There was a strong correlation between UCP screening rates for their female patients with a life expectancy of less than 7 years and 7 years or longer (r = 0.67, P < .001). Most physician characteristics associated with higher screening rates (e.g., being female and foreign trained) in women with longer life expectancy were also associated with higher screening rates in women with limited life expectancy.
Conclusion: Providers with high mammography screening rates for women with longer life expectancy also tend to screen women with limited life expectancy. Quality indicators for screening practice can be improved by distinguishing appropriate use from overuse based on patient life expectancy.
© 2013, Copyright the Authors Journal compilation © 2013, The American Geriatrics Society.
Conflict of interest statement
Figures
References
-
- Welch HG. Screening mammography--a long run for a short slide? N Engl J Med. 2010;363(13):1276–1278. - PubMed
-
- Satariano WA, Ragland DR. The effect of comorbidity on 3-year survival of women with primary breast cancer. Ann Intern Med. 1994;120(2):104–110. - PubMed
-
- Nyström L, Andersson I, Bjurstam N, et al. Long-term effects of mammography screening: updated overview of the Swedish randomised trials. Lancet. 2002;359(9310):909–919. - PubMed
Publication types
MeSH terms
Grants and funding
LinkOut - more resources
Full Text Sources
Other Literature Sources
Medical
