Review
. 2013 Feb 28;152(5):945-56.
doi: 10.1016/j.cell.2013.02.005.

Encoding and decoding cellular information through signaling dynamics

Affiliations
Review

Encoding and decoding cellular information through signaling dynamics

Jeremy E Purvis et al. Cell. .

Abstract

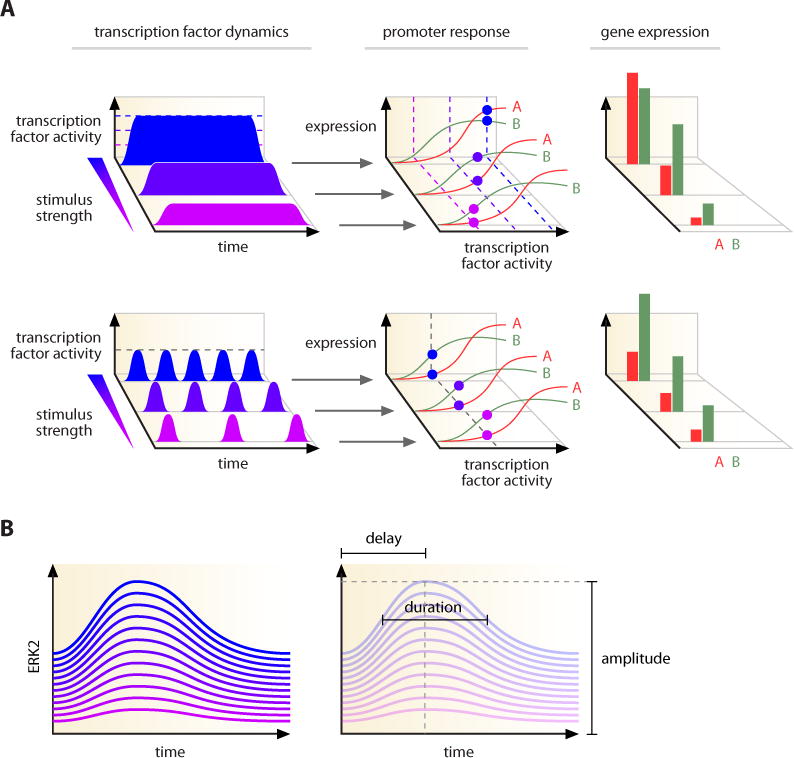
A growing number of studies are revealing that cells can send and receive information by controlling the temporal behavior (dynamics) of their signaling molecules. In this Review, we discuss what is known about the dynamics of various signaling networks and their role in controlling cellular responses. We identify general principles that are emerging in the field, focusing specifically on how the identity and quantity of a stimulus is encoded in temporal patterns, how signaling dynamics influence cellular outcomes, and how specific dynamical patterns are both shaped and interpreted by the structure of molecular networks. We conclude by discussing potential functional roles for transmitting cellular information through the dynamics of signaling molecules and possible applications for the treatment of disease.


Figures

Figure 1
Figure 1. Quantifying the dynamics of signaling molecules in living systems
(A) Different inputs may be distinguished by differences in static quantities such as the abundance, identity (e.g. posttranslational modifications, binding of a cofactor), or location of signaling molecules. However, not only the absolute number matters (e.g. how much of a specific protein is found in a cell at a specific time), but also the temporal pattern of these variables (the shape of the curve describing changes in concentration, localization and modifications over time). (B) Examples for measureable features of a dynamic signal including amplitude, frequency, duration, delay, and cumulative level. (C) Cellular processes occur with characteristic time scales ranging from sub-second to several days. Taking measurements at the appropriate time scale is crucial for capturing the true dynamical behavior. (D) Measurements of cell populations can obscure dynamics of individual cells. For example, pulses of p53 in response to DNA damage have a fixed height and width. Different number of pulses and loss of synchrony among individual cells gives the appearance of damped oscillations in the population. Similarly, the cleavage of caspase substrates during apoptosis appears to occur gradually in a population of cells. Single-cell imaging reveals that cleavage is rapid but with a variable delay from cell to cell.
Figure 2
Figure 2. The identity and strength of upstream stimuli can be encoded in the dynamics of signaling molecules
(A) Dynamics of ERK activation in response to growth factors. Stimulation of mammalian cells with EGF or NGF results in transient or sustained ERK activation, respectively. Dynamics represent population responses. (B) Dynamics of NF-κB in response to TNFα or LPS. Stimulation with TNFα results in oscillatory pattern of repeated nuclear accumulation followed by nuclear export. LPS stimulation causes a sustained level of NF-κB translocation after a short delay. Dynamics represent single-cell responses. (C) Dynamics of yeast transcription factor Msn2. Yeast respond to glucose limitation with a coordinated burst of Msn2 translocation to the nucleus followed by a series of sporadic bursts of Msn2 activity. Increasing strength of these stresses lengthens the duration of the initial burst and increases the frequency of sporadic bursting. Oxidative stress triggers a sustained nuclear accumulation of Msn2. Increased oxidative stress intensity results in a higher amplitude and shorter delay until the signal peak. Dynamics represent single-cell responses. (D) Dynamics of p53 in response to DNA damage. γ-radiation causes double strand DNA breaks and leads to repeated pulses of p53. Increasing damage leads to more pulses. UV radiation triggers a single pulse of p53 that increases in amplitude and duration in proportion to the UV dose. Dynamics represent single-cell responses.
Figure 3
Figure 3. The dynamics of signaling molecules are associated with specific downstream responses
(A) Transient activation of ERK leads to proliferation of neuronal precursor cells. Sustained ERK levels precede differentiation into neurons. (B) Transient nuclear accumulation of NF-κB triggers expression of nonspecific inflammatory response genes. Sustained nuclear NF-κB levels leads to expression of additional cytokines and chemokines required for adaptive immune response. (C) p53 pulses in response to γ-irradiation are associated with cell cycle arrest. Prolonged p53 signaling, as in response to UV radiation, leads to apoptosis.
Figure 4
Figure 4. Targeted perturbations of protein dynamics can help reveal the role of dynamics in cellular responses
(A) Perturbation of NF-κB translocation dynamics alters gene expression. Stimulation with TNFα triggers IKK-dependent activation of NF-κB and targeting to the nucleus. Subsequent export leads to oscillations of NF-κB nuclear activity. Blocking nuclear export with LMB results in sustained accumulation of nuclear NF-κB. This leads, counterintuitively, to a shift from sustained to transient target gene expression, because the negative regulator IκB is also held in the nucleus. (B and C) Altering ERK dynamics changes phenotypic responses. (B) EGF stimulation produces a transient ERK activation and allows cell proliferation of PC-12 cells. The addition of PMA, an activator of PKC, increases positive feedback from ERK to Raf and sustains the levels of activated ERK in response to EGF. The resulting profile, which resembles the dynamics of NGF stimulation, promotes differentiation. (C) NGF stimulation triggers sustained activation of ERK and leads to cellular differentiation. Inhibition of the positive feedback from ERK to Raf with the PKC inhibitor Gö7874 produces a transient-like ERK response similar to that induced by NGF. This leads to a switch from differentiation to proliferation. (D) Artificially sustained p53 pulses promote cellular senescence. γ-irradiation induces double strand DNA breaks and activation of ATM kinase. The resulting pulses of p53 are driven in part by negative feedback from Mdm2 to p53. When the ubiquitin ligase activity of Mdm2 is blocked by the small molecule Nutlin-3, p53 levels accumulate. A sequence of Nutlin-3 doses that sustain p53 dynamics leads to cellular senescence.
Figure 5
Figure 5. Linking dynamics with network structure: encoding and decoding mechanisms
(A and B) Differences in network architecture shape dynamical responses. (A) Transient activation of ERK in response to EGF is facilitated in part by negative feedback through SOS. Sustained ERK activation by NGF relies on positive feedback through PKC, which is not activated downstream of EGFR. (B) γ-radiation causes double-strand DNA breaks and leads to p53 pulses. Negative feedback through the phosphatase Wip1 attenuates the damage signal by dephosphorylating ATM and thereby controls the amplitude and duration of p53 pulses. UV radiation activates ATR kinase. The lack of negative feedback between Wip1 and ATR in the UV pathway is responsible for the difference in p53 dynamics. (C and D) Network structure selectively interprets dynamics. (C) A network of early responding gene products, such as c-Fos, are induced by activated ERK. Transient ERK activation is not sufficient to productively accumulate c-Fos, whereas sustained ERK activation leads to accumulation of c-Fos. c-Fos is phosphorylated by ERK (pFos) and leads to expression of pro-differentiation genes. Thus, the accumulation of early gene products such as c-Fos serves as a persistence detector for sustained ERK activation. (D) A gene regulatory circuit discriminates transient from persistent TLR4 signals. NF-κB and C/EBPδ form a coherent feed-forward loop to stimulate maximum expression of Il6 transcription. Attenuation of transient LPS signals is mediated by inhibition through ATF3, whereas the dramatic increase in Il6 under persistent LPS stimulation is due in part to positive feedback through autoregulation of C/EBPδ.
Figure 6
Figure 6. Specific control mechanisms achieved through modulation of dynamics
(A) (top) Different amplitudes of a transcription factor lead to different expression of target genes depending on their promoter response curves. Different amplitudes of the transcription factor are marked by purple (lowest) to blue (highest) dotted lines. Promoter response curves for two hypothetical genes, A and B, are shown as red and green lines. (bottom) Frequency modulated transcription factor dynamics maintains relative proportion of target gene expression. Regardless of stimulus strength, transcription factor activity reaches the same level (gray dotted line) and therefore activates target gene promoters at the same location in the response curves. Stimulus strength affects the frequency of the transcription factor activation; higher frequency (blue) will strike the promoters more often than lower frequency activation (purple). This leads to the accumulation of target genes at the same relative proportion (right panel). See main text and (Cai et al., 2008) for further details. (B) Timing and fold change of ERK2 response is more conserved between individual cells than absolute levels. Individual cells vary considerably in the absolute levels of ERK2 under basal conditions as well as after stimulation with EGF. Certain parameters that describe the timing of the response, however, show less variability. The delay until peak activation, signal duration, and fold change are among the most conserved parameters. See (Cohen-Saidon et al., 2009).

References

    1. Albeck JG, Burke JM, Spencer SL, Lauffenburger DA, Sorger PK. Modeling a snap-action, variable-delay switch controlling extrinsic cell death. PLoS Biol. 2008;6:2831–2852. - PMC - PubMed
    1. Alon U. Network motifs: theory and experimental approaches. Nat Rev Genet. 2007;8:450–461. - PubMed
    1. Amit I, Citri A, Shay T, Lu Y, Katz M, Zhang F, Tarcic G, Siwak D, Lahad J, Jacob-Hirsch J, et al. A module of negative feedback regulators defines growth factor signaling. Nat Genet. 2007;39:503–512. - PubMed
    1. Ashall L, Horton CA, Nelson DE, Paszek P, Harper CV, Sillitoe K, Ryan S, Spiller DG, Unitt JF, Broomhead DS, et al. Pulsatile stimulation determines timing and specificity of NF-kappaB-dependent transcription. Science (New York, NY) 2009;324:242–246. - PMC - PubMed
    1. Bakstad D, Adamson A, Spiller DG, White MR. Quantitative measurement of single cell dynamics. Curr Opin Biotechnol. 2012;23:103–109. - PubMed

Publication types

Substances