. 2013 Feb 28;152(5):984-96.
doi: 10.1016/j.cell.2013.01.038.

An AT-hook domain in MeCP2 determines the clinical course of Rett syndrome and related disorders

Affiliations

An AT-hook domain in MeCP2 determines the clinical course of Rett syndrome and related disorders

Steven Andrew Baker et al. Cell. .

Abstract

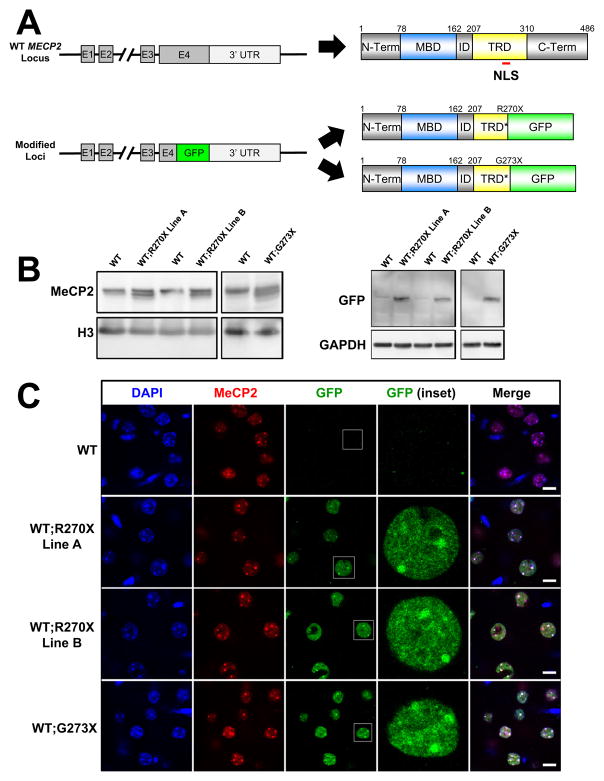
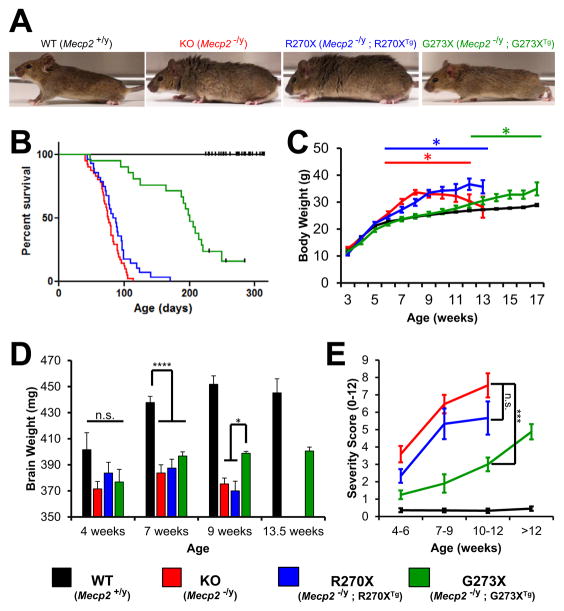
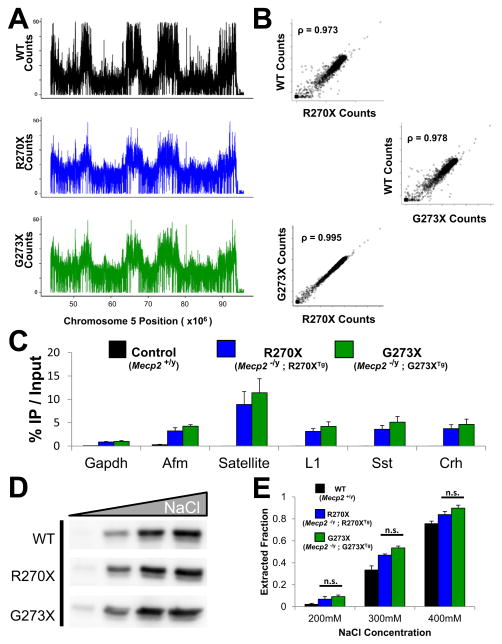
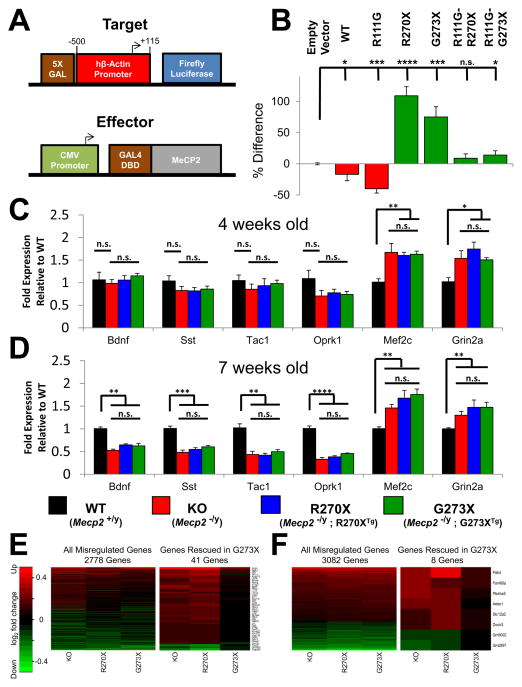
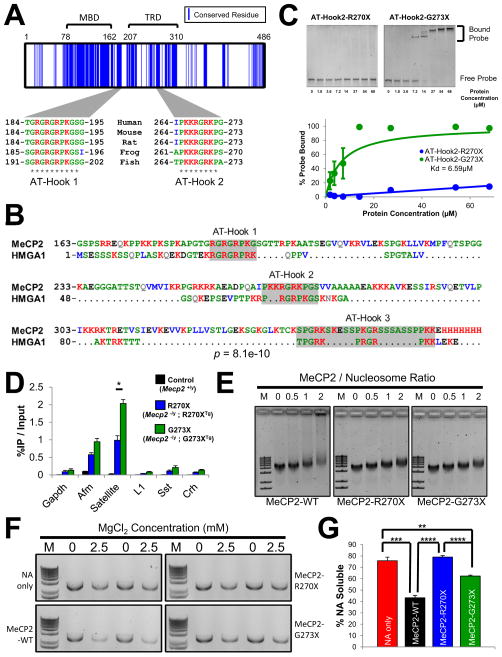
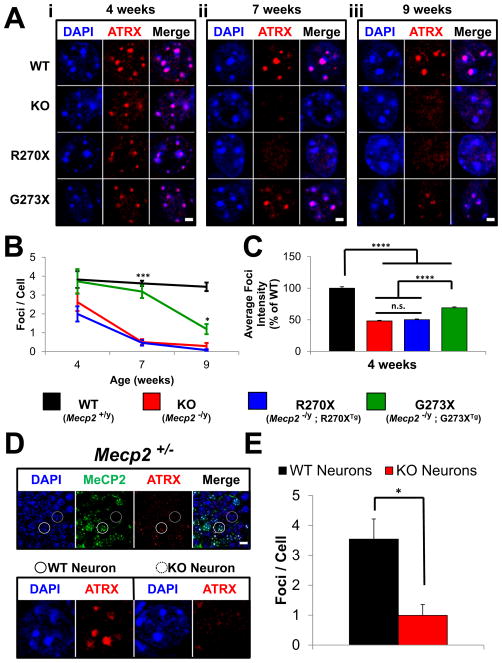
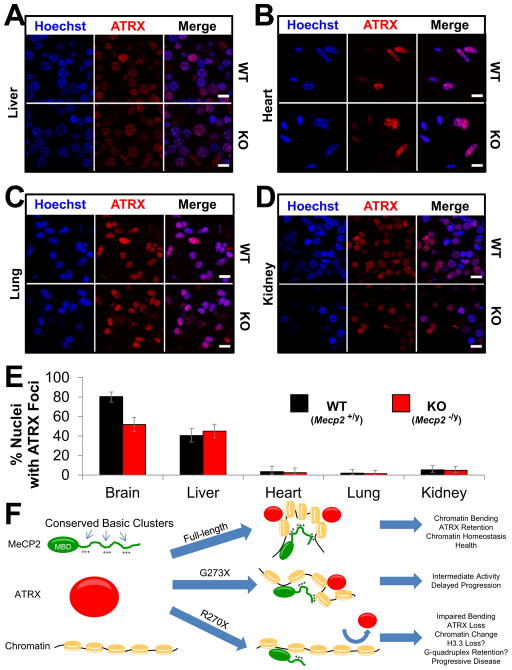
Mutations in the X-linked MECP2 cause Rett syndrome, a devastating neurological disorder typified by a period of apparently normal development followed by loss of cognitive and psychomotor skills. Data from rare male patients suggest symptom onset and severity can be influenced by the location of the mutation, with amino acids 270 and 273 marking the difference between neonatal encephalopathy and death, on the one hand, and survival with deficits on the other. We therefore generated two mouse models expressing either MeCP2-R270X or MeCP2-G273X. The mice developed phenotypes at strikingly different rates and showed differential ATRX nuclear localization within the nervous system, over time, coinciding with phenotypic progression. We discovered that MeCP2 contains three AT-hook-like domains over a stretch of 250 amino acids, like HMGA DNA-bending proteins; one conserved AT-hook is disrupted in MeCP2-R270X, lending further support to the notion that one of MeCP2's key functions is to alter chromatin structure.


Figures

Figure 1
Figure 1
Design and characterization of WT;R270X and WT;G273X transgenic mice (A) Schematic of MECP2 locus the corresponding WT protein product (top). Diagrams are not to scale but positions along the primary sequence and location of the canonical NLS are indicated. Schematic indicating the final modified loci containing a GFP tag inserted in place of the codon for R270 or G273 and the corresponding mutant protein products (bottom). MBD=methyl-CpG binding domain and TRD=transcriptional repression domain. * indicates a truncated TRD. (B) Western blot analysis using whole brain lysates for each transgenic line and their WT littermates and an antibody against the N-terminus that recognizes WT and both mutant forms of MeCP2. Mutant MeCP2 fused with GFP migrates below MeCP2-WT. (C) Mutant MeCP2 localizes with MeCP2-WT in cortical tissue using double immunofluorescence. The C-terminus MeCP2 antibody is specific for MeCP2-WT. Scale bars represent 10 μm. See also Figure S1.
Figure 2
Figure 2
Phenotypic characterization of R270X and G273X mice (A) Representative photographs of WT, KO, R270X and G273X mice at 8 weeks of age; KO and R270X mice have disheveled fur and are overweight. (B) Kaplan-Meier curves for 4 genotype classes. Censored animals are indicated with a black tick mark. n = 54, 41, 28, 21 for WT, KO, R270X, and G273X, respectively. (C) Average body weight plotted versus age. * p<0.05 compared to WT. Maximum n = 54, 41, 28, 21 for WT, KO, R270X, and G273X, respectively. (D) Average brain weights for 4 genotype classes shown at 4, 7, and 9 weeks. WT and G273X brains were also weighed at 13.5 weeks. **** p<0.0001 and * p<0.05. n = 6, 7, 8, 3 for WT and n = 6, 6, 6, 3 for G273X at 4, 7, 9, and 13.5 weeks, respectively. n = 8, 7, 8 for KO and n = 6, 6, 5 for R270X at 4, 7, and 9 weeks, respectively. (E) Average cumulative severity scores plotted against age. *** p<0.001, Mann-Whitney U Test. n = 25, 20, 15, 22 for WT and n = 12, 10, 10, 8 for G273X at 4–6, 7–9, 9–12, and >12 weeks, respectively. n = 17, 15, 11 for KO and n = 12, 6, 6 for R270X at 4–6, 7–9, and 9–12 weeks, respectively. All error bars show SEM. See also Figure S2.
Figure 3
Figure 3
MeCP2-R270X and MeCP2-G273X bind DNA globally (A) GFP antibodies were used to immunoprecipitate MeCP2-R270X and MeCP2-G273X from whole brain cross-linked chromatin of either R270X or G273X mice, respectively. Recovered DNA was subjected to deep sequencing. ChIP-Seq counts over a selected region of mouse chromosome 5 for MeCP2-R270X and MeCP2-G273X are compared to MeCP2-WT. Raw reads were binned per 100kb and the number of counts per bin are displayed over the indicated chromosome position. (B) Correlation plots between the number of ChIP-Seq reads per 100kb bin across the genome compared for WT vs. R270X (top), WT vs. G273X (middle) and R270X vs. G273X (bottom). ρ denotes Spearman’s Correlation. (C) Isolated DNA as in (A) was subjected to qPCR analysis using primers designed for the promoters of the indicated genes or repetitive elements. Satellite refers to mouse major satellite DNA, L1 refers to the mouse L1 retrotransposon. In addition to R270X and G273X mice ChIP-qPCR was also performed on WT mice that lack GFP as a control for antibody specificity and is plotted to the left of R270X for each gene or repetitive element. n = 3 for R270X and G273X. (D) Whole brain nuclei were purified from WT, R270X, or G273X mice and resuspended in buffers comprised of 200mM, 300mM, 400mM, or 1M NaCl. An antibody for the MeCP2 N-terminus shows the amount of MeCP2 extracted under each condition. n = 3. (E) The average extracted fractions from the experiment described in (D) are plotted for each genotype above the corresponding NaCl concentration. Data are normalized for the amount of MeCP2 extracted in 1M NaCl. n = 3 mice per genotype. Pooled data show mean +/− SEM. See also Figure S3.
Figure 4
Figure 4
MeCP2-R270X and MeCP2-G273X have similar transcriptional regulatory function (A) Schematic of constructed transcriptional assay. The target reporter construct contains a 5X Gal DNA binding site immediately upstream of the human β-Actin promoter with endpoints relative to TSS indicated. The effector construct consists of the CMV promoter driving expression of WT or mutant MeCP2 fused at the N-terminus to the Gal4 DNA Binding Domain (Gal4 DBD). A control reporter lacking the 5X Gal site was cotransfected to monitor transfection efficiency. (B) Average luciferase activity of N2a lysates transfected with the target reporter construct and the indicated effector construct. Data are normalized to control reporter activity and the percent difference relative to empty effector is indicated. **** p<0.0001, *** p<0.001, * p<0.05, Student’s t-test. n = 3. (C and D) Hypothalamic RNA levels were quantified by qRT-PCR for 4 genes down-regulated in KO mice (Bdnf, Sst, Oprk1, and Tac1) and two up-regulated genes (Mef2c and Grin2a). Transcript levels were normalized to Gapdh and represented as the fold expression relative to WT. **** p<0.0001, *** p<0.001, ** p<0.01, * p<0.05 (C) Gene expression of 4-week old animals. n = 6, 7, 6, 6 for WT, KO, R270X, and G273X, respectively.(D) Gene expression of 7-week old animals. n = 7, 6, 6, 6 for WT, KO, R270X, and G273X, respectively. (E and F) Hippocampal RNA was quantified by microarray and the abundance of significantly altered genes is displayed as the log2(fold change) relative to WT. The intensity key indicates genes that are upregulated in red and genes that are downregulated in green. (E) (Left) All genes that were misregulated relative to WT in any mutant at 4 weeks of age. (Right) Genes that were misregulated in KO and R270X mice but rescued in G273X mice at 4 weeks of age. n = 4 animals per genotype. (F) (Left) All genes that were misregulated relative to WT in any mutant at 9 weeks of age. (Right) Genes that were misregulated in KO and R270X mice but rescued in G273X mice at 9 weeks of age. n = 4 animals per genotype. Pooled data show mean +/− SEM. See also Figure S4.
Figure 5
Figure 5
A conserved AT-hook domain between R270 and G273 enables MeCP2 to alter chromatin structure (A) Conserved MeCP2 residues shared by fish, frog, rat, mouse, and human. Sequences were aligned with ClustalW2 and blue lines indicate residues sharing identity. Two blocks of conserved amino acids corresponding to AT-Hook 1 and AT-Hook 2 are shown. * denotes identity within the aligned sequences. (B) PROMALS3D alignment of the human MeCP2 C-terminus (residues 163–486) and the human HMGA1 sequence. PairwiseStatSig method was used to compute significance (Ankit Agrawal, 2011). p=8.1e–10 after 200000 iterations. (C) (Top) A recombinant form of the MeCP2 AT-Hook 2 domain (amino acids 257–272) was used in an EMSA assay to test binding to a 64-mer double stranded DNA probe (66.7nM). The AT-Hook 2 domain truncated at R270 (R270X) failed to bind DNA. The full AT-Hook 2 domain ending at G273 (G273X) readily forms the indicated complexes with the probe DNA. (Bottom) For AT-Hook 2-G273X a hyperbolic model was fit to the data and the apparent Kd was calculated to be 6.59μM; quantification from 3 independent experiments. (D) Native ChIP with anti-GFP on whole brain chromatin from R270X and G273X mice. Satellite refers to mouse major satellite DNA, L1 refers to the mouse L1 retrotransposon. WT mice that lack GFP were used as a control for antibody specificity. * p<0.05. n = 3. (E) EMSA reaction with methylated nucleosomal arrays (NAs) and recombinant MeCP2. MeCP2-WT, MeCP2-R270X, and MeCP2-G273X were added at the indicated MeCP2/Nucleosome ratios. Each protein shifted the NAs at a similar concentration. MeCP2-WT induces the formation of higher order complexes, evident as a long trail above the shifted band. M stands for the 1Kb plus DNA marker. n = 6. (F) Recombinant MeCP2 was mixed with methylated NAs and after the addition of MgCl2 at the indicated concentration the oligomerized material was separated by centrifugation. The NAs that remain in the soluble fraction were run on an agarose gel and visualized by ethidium bromide staining. M stands for the 1Kb plus DNA marker. (G) Quantification of the experiment described in (F). **** p<0.0001, *** p<0.001, ** p<0.01, Student’s t-test. n = 4. Pooled data show mean +/− SEM. See also Figure S5.
Figure 6
Figure 6
ATRX mislocalization in various Mecp2 mutants (A) Immunofluorescence for ATRX in the hippocampus of WT, KO, R270X, and G273X mice. PCH appears as DAPI bright foci within neurons and colocalizes with ATRX staining in WT animals at all ages. (i) At 4 weeks of age ATRX localization is similar in WT and mutant mice. (ii) At 7 weeks of age KO and R270X mice show a noticeable reduction in the number of bright ATRX foci, whereas G273X mice remain similar to WT mice. (iii) At 9 weeks KO, R270X, G273X mice show a decrease in the number of bright ATRX foci relative to WT. Scale bars represent 2 μm. Images are of individual neuronal nuclei, for lower power images of more neurons see Figure S6A. (B) Quantification of the average number of ATRX foci detected per neuron in each genotype at 4, 7, and 9 weeks of age. *** p<0.001 and * p<0.05 for G273X compared to both KO and R270X. n = 6 high-power fields from 2 mice per genotype per age. (C) Quantification of the average foci intensities for each genotype at 4 weeks of age. **** p<0.0001. n = 651 WT foci, n = 513 KO foci, n = 344 R270X foci, and n = 735 G273X foci from 2 mice per genotype. (D) Double immunofluorescence for MeCP2 and ATRX in hippocampus of symptomatic Mecp2 +/− heterozygous female mice. (Top) MeCP2 expressing neurons (solid circle); neurons not expressing MeCP2 (dashed circle). ATRX foci are brighter in MeCP2 positive neurons compared to adjacent MeCP2 negative neurons. Scale bars represent 10 μm. n = 2 mice. (Bottom) Higher magnification image of the WT and KO neuron circled in the upper panel. (E) Quantification of the average number of ATRX foci detected per neuron in symptomatic Mecp2 +/− heterozygous female mice. n = 4 high-power fields from 2 mice. Pooled data show mean +/− SEM. See also Figure S6.
Figure 7
Figure 7
ATRX mislocalization is specific to the brain (A–D) Immunofluorescence for ATRX in fresh nuclei prepared from WT and KO mice at 9 weeks of age. Nuclei are counterstained with Hoechst from liver (A), heart (B), lung (C), and kidney (D). Scale bars represent 10 μm. n = 3 mice per genotype. (E) Quantification of the experiment described in (A–D and Figure S7C). The percentage of ATRX positive nuclei with foci localizing to PCH from WT and KO animals is plotted for each tissue. Error bars represent 95% confidence intervals. For brain n = 226 and 183; for liver n = 192 and 195; for heart n = 112 and 121; for lung n = 151 and 195; for kidney n = 184 and 204 nuclei from WT and KO mice respectively. (F) Proposed model for MeCP2 in chromatin homeostasis. MeCP2 contains highly conserved basic clusters (+++) within its disordered C-terminal region. MeCP2 first binds DNA through its MBD, but the presence of multiple DNA binding elements allow MeCP2 to alter chromatin conformation, leading to homeostasis as indicated by the recruitment of ATRX to PCH. When the C-terminus becomes truncated (e.g., G273X) this activity is reduced. Further truncation beyond the AT-Hook 2 domain (e.g., R270X) severely impairs the function of MeCP2, chromatin is no longer maintained in a physiological conformation, and ATRX is lost from PCH. See also Figure S7.

Comment in

References

    1. Amir RE, Van den Veyver IB, Wan M, Tran CQ, Francke U, Zoghbi HY. Rett syndrome is caused by mutations in X-linked MECP2, encoding methyl-CpG-binding protein 2. Nat Genet. 1999;23:185–188. - PubMed
    1. Ankit Agrawal XH. Pairwise Statistical Significance of Local Sequence Alignment Using Sequence-Specific and Position-Specific Substitution Matrices. IEEE/ACM Transactions on Computational Biology and Bioinformatics. 2011;8:194–205. - PubMed
    1. Ben-Shachar S, Chahrour M, Thaller C, Shaw CA, Zoghbi HY. Mouse models of MeCP2 disorders share gene expression changes in the cerebellum and hypothalamus. Human Molecular Genetics. 2009;18:2431–2442. - PMC - PubMed
    1. Brocher J, Vogel B, Hock R. HMGA1 down-regulation is crucial for chromatin composition and a gene expression profile permitting myogenic differentiation. BMC Cell Biology. 2010;11:64. - PMC - PubMed
    1. Catez F, Ueda T, Bustin M. Determinants of histone H1 mobility and chromatin binding in living cells. Nat Struct Mol Biol. 2006;13:305–310. - PMC - PubMed

Publication types

MeSH terms

Associated data