. 2013 Feb 28;152(5):1160-72.
doi: 10.1016/j.cell.2013.02.007.

Profiling of ubiquitin-like modifications reveals features of mitotic control

Affiliations

Profiling of ubiquitin-like modifications reveals features of mitotic control

Yifat Merbl et al. Cell. .

Abstract

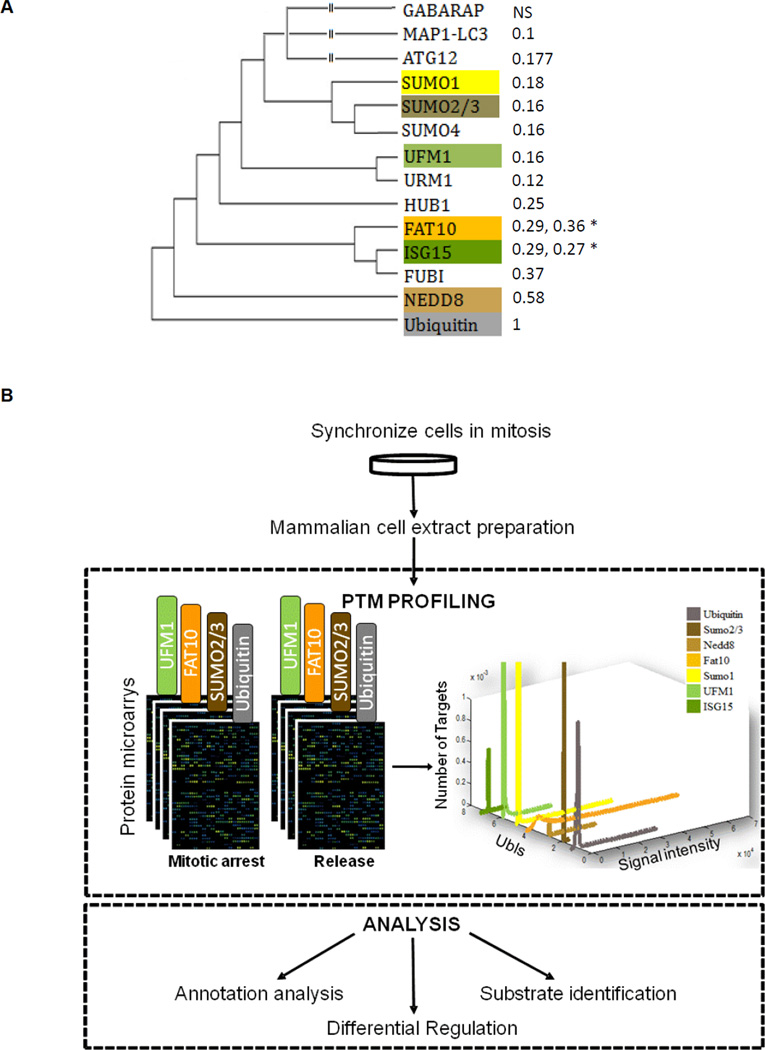
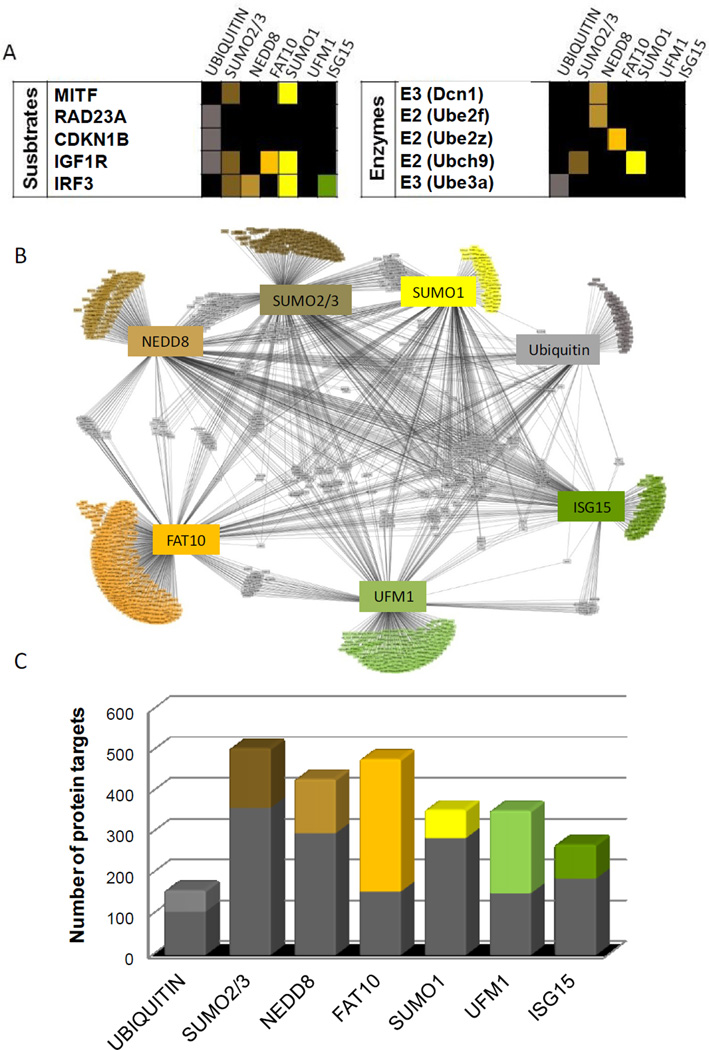
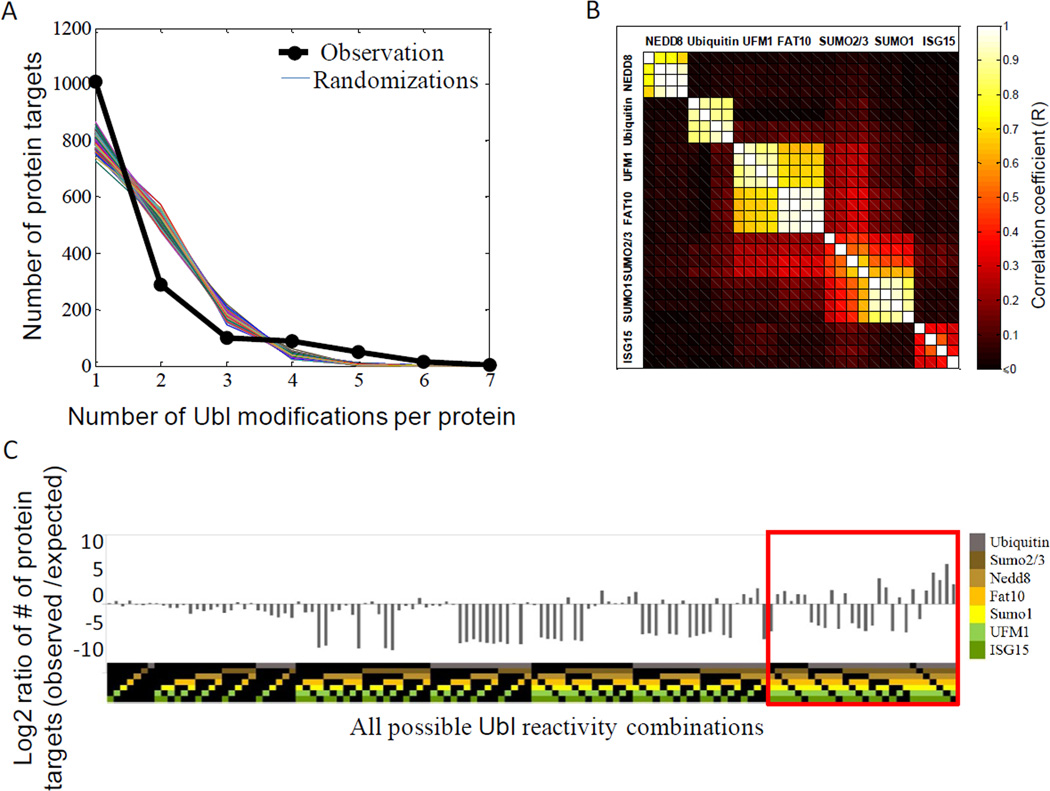
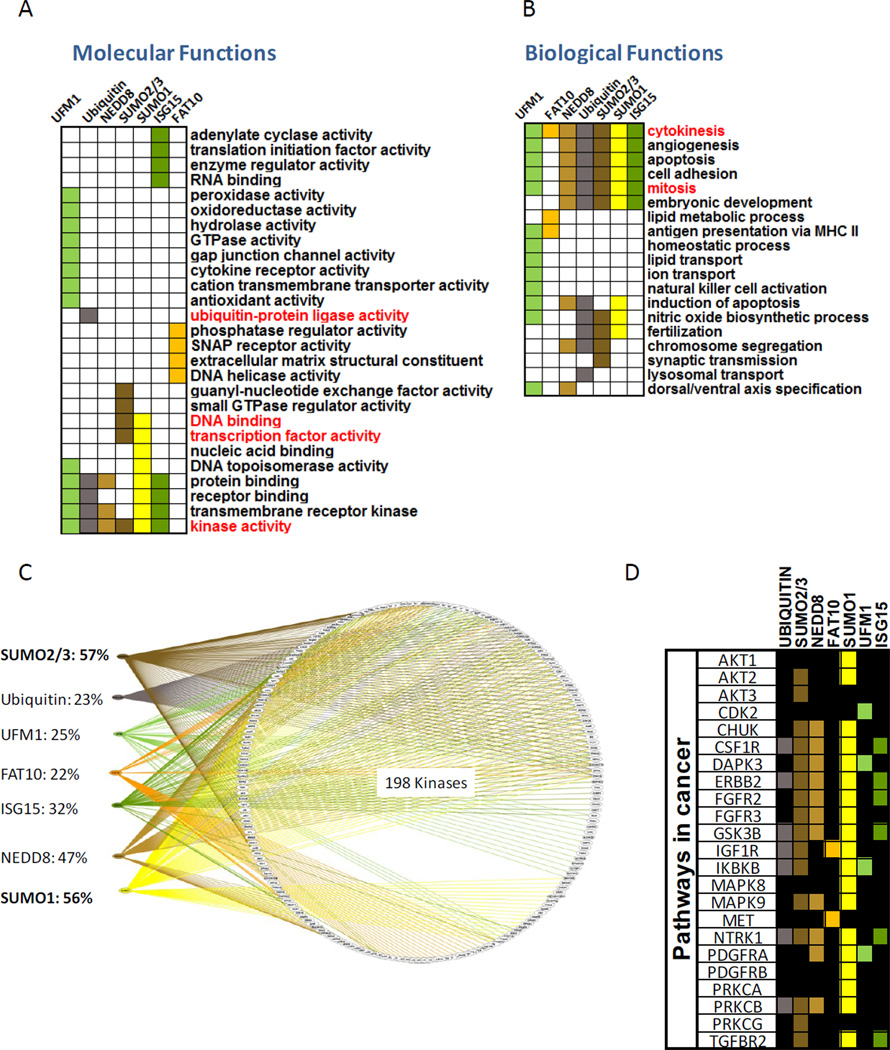
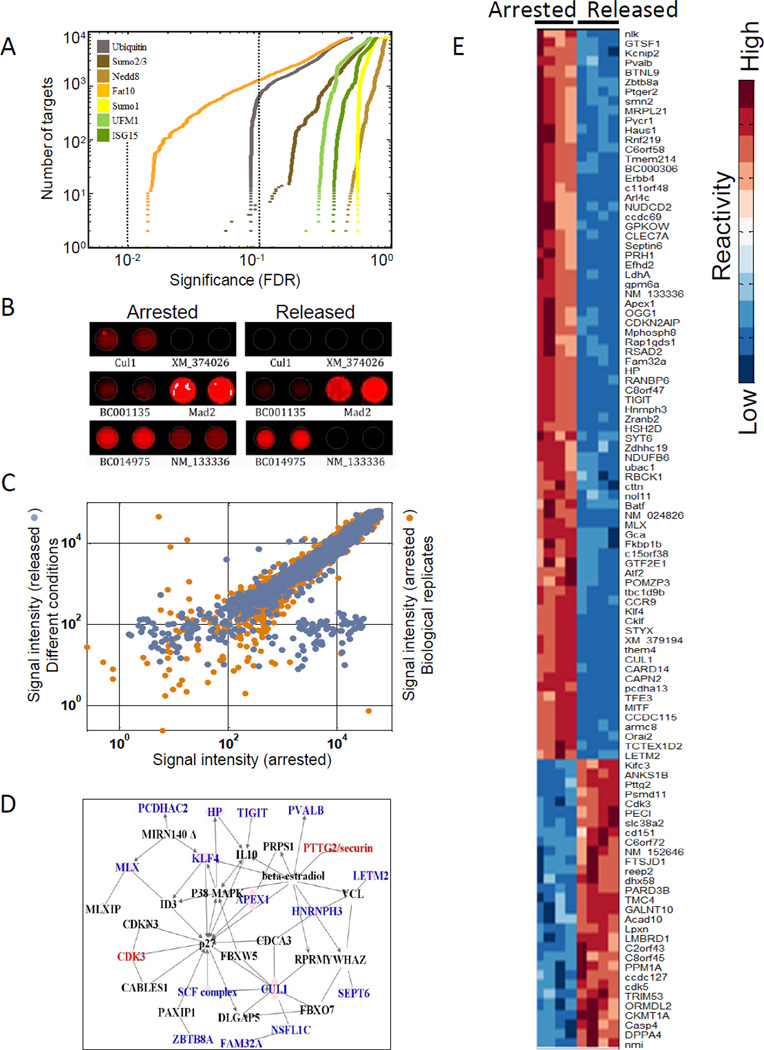
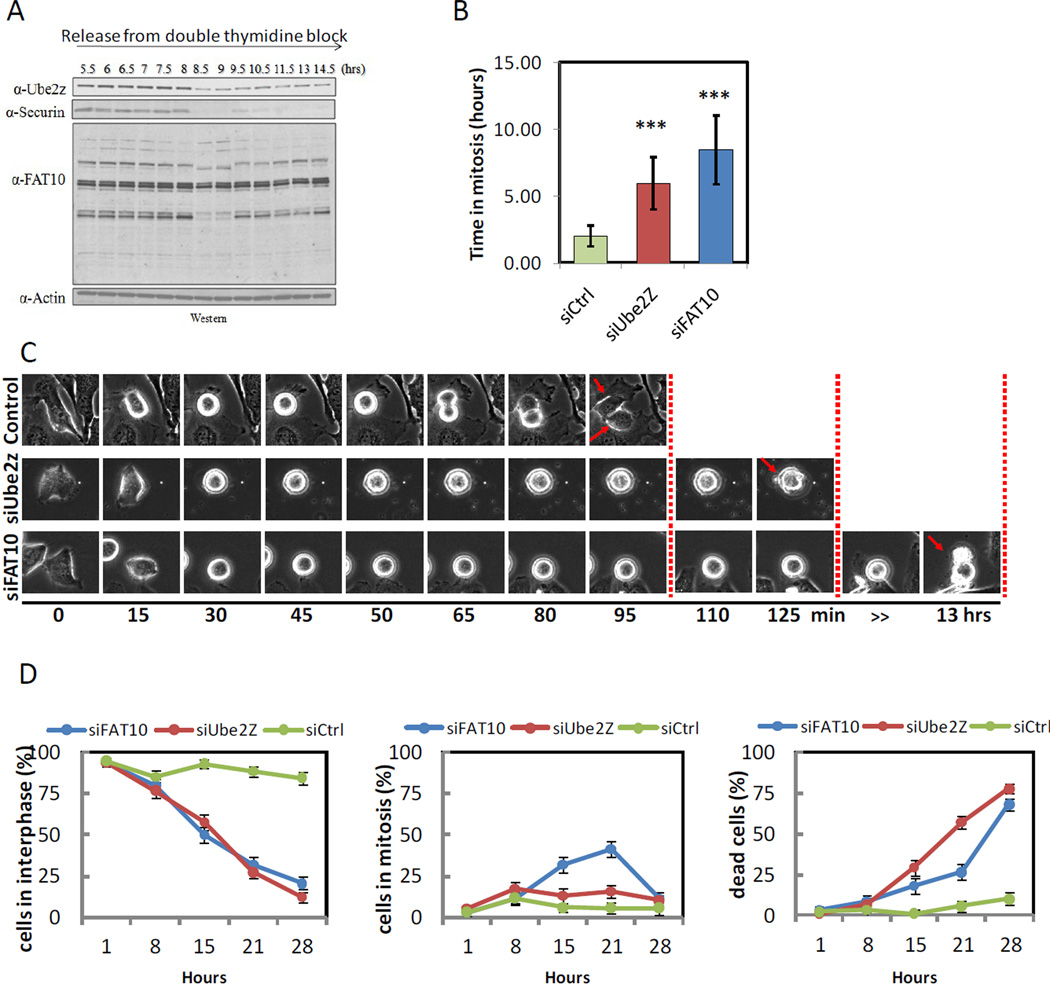
Ubiquitin and ubiquitin-like (Ubl) protein modifications affect protein stability, activity, and localization, but we still lack broad understanding of the functions of Ubl modifications. We have profiled the protein targets of ubiquitin and six additional Ubls in mitosis using a functional assay that utilizes active mammalian cell extracts and protein microarrays and identified 1,500 potential substrates; 80-200 protein targets were exclusive to each Ubl. The network structure is nonrandom, with most targets mapping to a single Ubl. There are distinct molecular functions for each Ubl, suggesting divergent biological roles. Analysis of differential profiles between mitosis and G1 highlighted a previously underappreciated role for the Ubl, FAT10, in mitotic regulation. In addition to its role as a resource for Ubl modifications, our study provides a systematic approach to analyze changes in posttranslational modifications at various cellular states.


Figures

Figure 1
Figure 1. Global identification of ubiquitin and Ubl targets in mitosis
(A) Phylogenetic relationship of selected members of the ubiquitin- like protein family. Branch lengths are proportional to phylogenetic distances and the percent similarity to ubiquitin sequences is given in parentheses. NS=Not Similar to ubiquitin by standard BLAST search. *Diubiquitin proteins (ISG15, FAT10) have two numbers for similarity representing each domain. (B) Experimental design. Mitotic HeLa S3 cell extracts were incubated on protein microarrays with or without the addition of Ubch10, a protein that abrogates the checkpoint arrest and allows the extracts to proceed toward mitotic exit. Ubl modifications on the spotted proteins are then measured by labeling the arrays with Ubl-specific antibodies, and fluorescently-labeled secondary antibodies are used to quantify the reactivity profile of the ~8000 proteins on the array toward each Ubl antibody.
Figure 2
Figure 2. Defining a Ubl modification network
(A) Examples of known Ubl targets and Ubl pathway enzymes identified by the assay. A color denotes reactivity toward that Ubl. The interactions reported in the literature are cited in the text. (B) The Ubl interaction network. Each protein is connected to the Ubl with which it interacts. Proteins that have multiple Ubls interactions are shown at the center and proteins that are reactive exclusively with one Ubl are shown at the rim. (C) The number of proteins targeted by each Ubl showing specificity of the Ubl pathways. The colored fractions represent the proportion of targets reacting uniquely with each Ubl whereas the grey fractions represent the targets reactive towards at least two Ubls. See related Figure S1.
Figure 3
Figure 3. The Ubl network features both exclusive and preferential targeting of substrates by different Ubls
(A) Comparison of observed distribution of Ubl reactivities with expected distribution for a random Ubl network. Each of the colored lines represents the calculated frequency from 1000 random networks simulations showing exclusivity over-representation at n=1 (targets of only one Ubl) and under-representation of targets with two (n=2) or three Ubl (n=3) reactivities. The black line represents the observed frequencies in the network. (B) Correlation analysis of Ubl profiles. Correlation coefficients between each of the Ubl reactivity profiles with all other microarrays reveals similarity among SUMO1 and SUMO2/3 targets as well as among FAT10 and UFM1 targets. Each square shows the correlation coefficient (R) between two microarray profiles, with 4 microarrays per Ubl. Black signifies no correlation or anti-correlation. Microarrays are grouped by their correlation (k-nearest neighbor clustering). (C) Ratio of observed versus expected frequencies of Ubl targets for each possible Ubl combination. The ratio represents the observed under-representation and over-representation of certain Ubl combinations when compared to a permutated network. Each Ubl combination is color coded according to the specific pattern of Ubl reactivity at the top.
Figure 4
Figure 4. Cellular and functional classification of Ubl targets
(A) Enrichment analyses of “molecular functions” among Ubl targets, assessed by over-representation of Gene Ontology (GO) terms for the targets of each Ubl. Terms discussed in the text appear in red. (B) Same analysis as in (A) but for the “biological processes” annotations. (C) Detailed breakdown of the subset of kinases in the network, and their Ubl specificities (color-coded lines), showing an extensive crosstalk between kinases and different Ubl modifiers. See Figure S2A for a higher resolution of this image with protein names. See related figures S2 and S3.
Figure 5
Figure 5. FAT10 targets are involved in cell cycle regulation and mitotic progression
(A) Signal intensity of FAT10ylated protein targets were measured under nocodazole arrest and upon release from mitotic arrest. Values under the two conditions were compared using ANOVA and the resulting p-values were plotted (ascending order) for each Ubl separately. The two dotted lines indicate p-value cutoff levels of 0.1 and 0.05 (orange and brown, respectively). The y-axis denotes the cumulative number of target proteins that showed the stated significance in differential reactivity. (B) An example of duplicate spots of a FAT10 modified substrate under the two conditions, showing differences in reactivity. (C) Signal intensity of two biological replicates was compared to the signal intensity under the two different conditions for each protein. The x-axis: FAT10 signal intensity (log scale) under nocodazole arrest. Y-axis: replicate biological conditions (orange) or upon release from nocodazole arrest (blue). Dots that are off the diagonal represent the proteins that were differentially modified by FAT10 (D) Potential targets that mapped onto a known interaction network for cell cycle regulation. Color denotes increased (red) or decreased (blue) reactivity upon release from the mitotic arrest. Black names are interactors in the network that were not targeted by FAT10. (E) Proteins showing the highest differential modification under the two conditions (106) were clustered based on similarity. Signal intensity for each protein was standardized to have mean reactivity of 0 and standard deviation of 1. See related Figure S4.
Figure 6
Figure 6. Inhibition of the FAT10 pathway using RNA interference leads to mitotic arrest and cell death
(A) FAT10, Ube2z and Securin protein levels during cell cycle progression. Samples were taken at the indicated time points (see Figure S6 for FACS analysis). (B) The duration of mitosis was quantified from time lapse movies. Cells treated with siRNA for Ube2z or FAT10 spent a significantly longer time in mitosis (p<0.05) when compared to cells treated with control siRNA. Error bars depict mean +/- standard error. (C) A representative cell (n>30 per condition) undergoing mitosis for each of the different condition (siFAT10, siUbe2z and siControl) is presented. (D) Quantitation of the percentage of cells in interphase (left), mitosis (middle) and percentage of dead cells (right) in each of the conditions during the course of the experiment. Error bars depict mean +/- standard error. See related Figures S5–7 as well as Movies S1–3.

References

    1. Aichem A, Kalveram B, Spinnenhirn V, Kluge K, Catone N, Johansen T, Groettrup M. The proteomic analysis of endogenous FAT10 substrates identifies p62/SQSTM1 as a substrate of FAT10ylation. J Cell Sci. 2012;125:4576–4585. - PubMed
    1. Aichem A, Pelzer C, Lukasiak S, Kalveram B, Sheppard PW, Rani N, Schmidtke G, Groettrup M. USE1 is a bispecific conjugating enzyme for ubiquitin and FAT10, which FAT10ylates itself in cis. Nat Commun. 2010a;1:1–10. - PubMed
    1. Aichem A, Pelzer C, Lukasiak S, Kalveram B, Sheppard PW, Rani N, Schmidtke G, Groettrup M. USE1 is a bispecific conjugating enzyme for ubiquitin and FAT10, which FAT10ylates itself in cis. Nat Commun. 2010b;1:13. - PubMed
    1. Ban R, Nishida T, Urano T. Mitotic kinase Aurora-B is regulated by SUMO-2/3 conjugation/deconjugation during mitosis. Genes Cells. 2011;16:652–669. - PubMed
    1. Bogunovic D, Byun M, Durfee LA, Abhyankar A, Sanal O, Mansouri D, Salem S, Radovanovic I, Grant AV, Adimi P, et al. Mycobacterial disease and impaired IFN-gamma immunity in humans with inherited ISG15 deficiency. Science. 2012;337:1684–1688. - PMC - PubMed

Publication types