. 2013 Apr 18;38(4):769-81.
doi: 10.1016/j.immuni.2013.02.010. Epub 2013 Feb 28.

Intraepithelial type 1 innate lymphoid cells are a unique subset of IL-12- and IL-15-responsive IFN-γ-producing cells

Affiliations

Intraepithelial type 1 innate lymphoid cells are a unique subset of IL-12- and IL-15-responsive IFN-γ-producing cells

Anja Fuchs et al. Immunity. .

Abstract

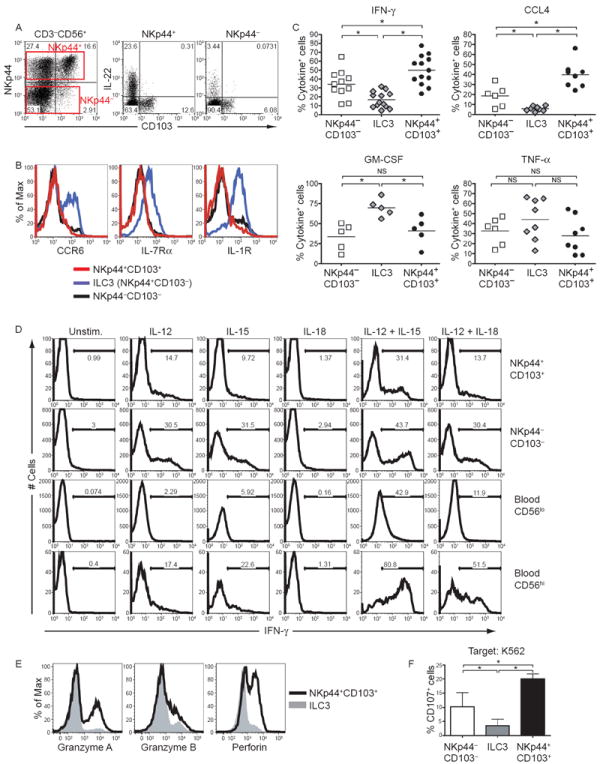
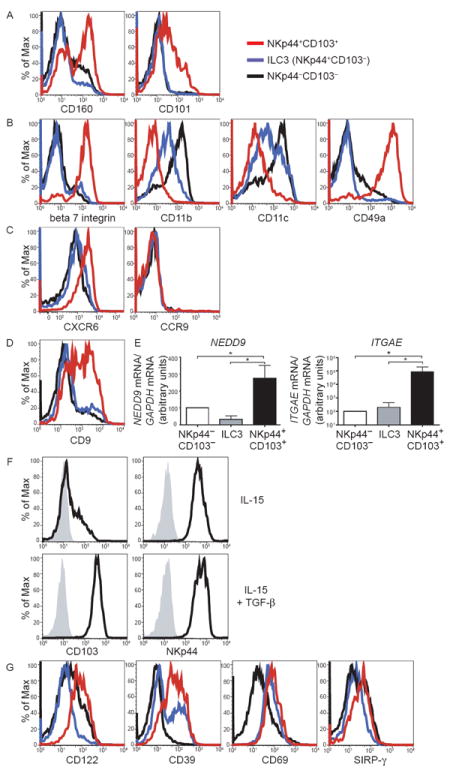
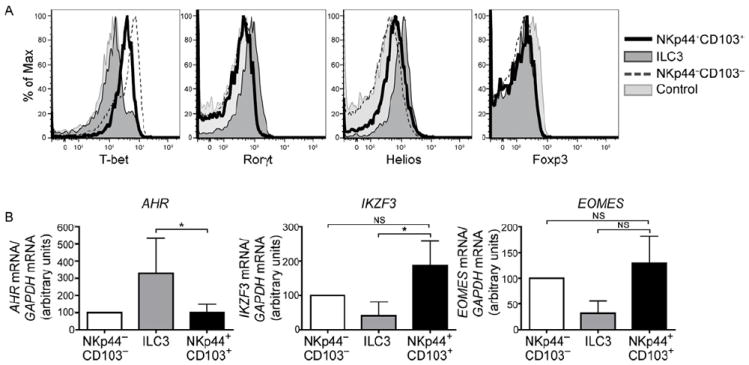
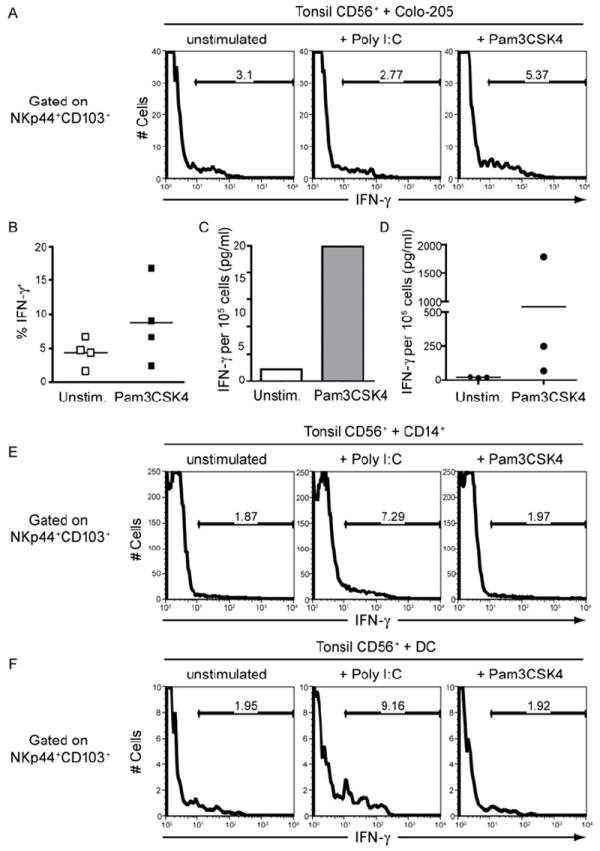
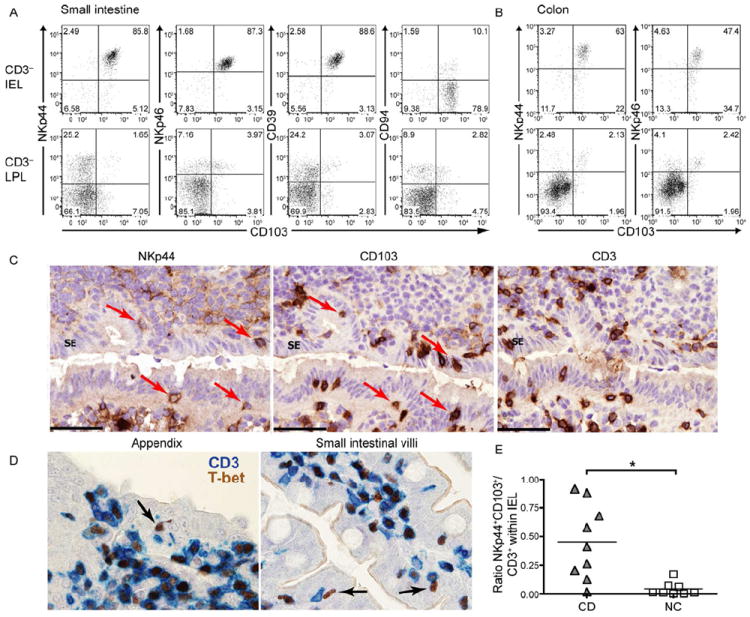
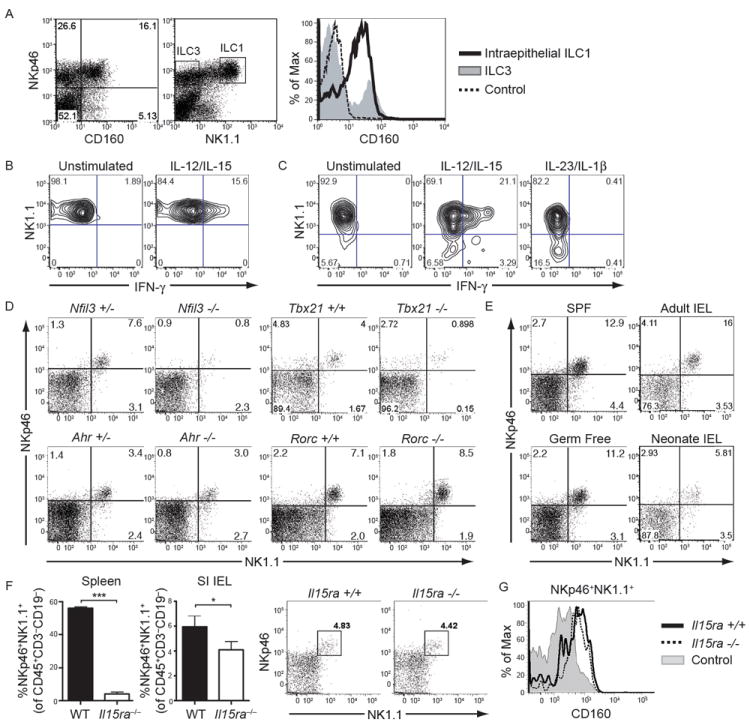
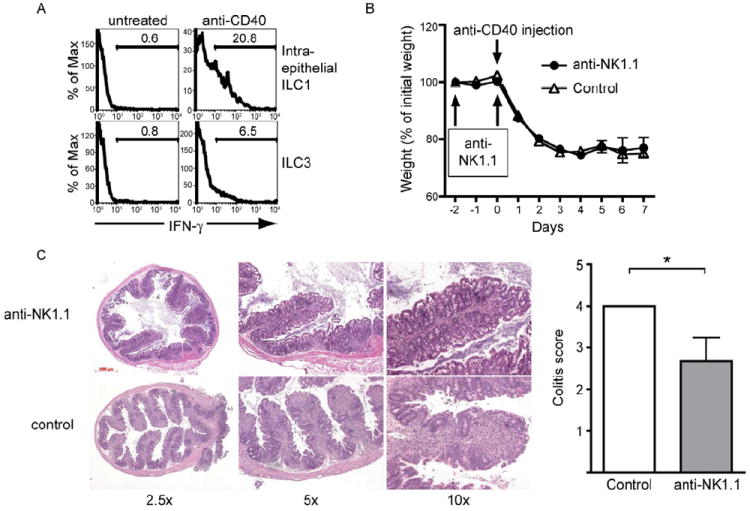
Mucosal innate lymphoid cell (ILC) subsets promote immune responses to pathogens by producing distinct signature cytokines in response to changes in the cytokine microenvironment. We previously identified human ILC3 distinguished by interleukin-22 (IL-22) secretion. Here we characterized a human ILC1 subset that produced interferon-γ (IFN-γ) in response to IL-12 and IL-15 and had a unique integrin profile, intraepithelial location, hallmarks of TGF-β imprinting, and a memory-activated phenotype. Because tissue-resident memory CD8(+) T cells share this profile, intraepithelial ILC1 may be their innate counterparts. In mice, intraepithelial ILC1 were distinguished by CD160 expression and required Nfil3- and Tbx21-encoded transcription factors for development, but not IL-15 receptor-α, indicating that intraepithelial ILC1 are distinct from conventional NK cells. Intraepithelial ILC1 were amplified in Crohn's disease patients and contributed to pathology in the anti-CD40-induced colitis model in mice. Thus, intraepithelial ILC1 may initiate IFN-γ responses against pathogens but contribute to pathology when dysregulated.


Figures

Figure 1
Figure 1. see also Figure S1. Mucosal NKp44+CD103+ and NKp44CD103 cells specialize in IFN-γ production in response to IL-12 and IL-15
CD56+ cells were enriched from tonsils and analyzed for their surface markers and functions. (A) Left, expression of NKp44 and CD103 on tonsil CD56+ cells, gated on live CD3CD19 cells. Right, tonsil CD56+ cells were stimulated with IL-23 and stained for intracellular IL-22. Cells were gated on the NKp44+ and the NKp44 fractions. (B) Surface markers of tonsilar NKp44+CD103+ cells (red lines), ILC3 (NKp44+CD103, blue lines), and NKp44CD103 cells (black lines). (C) After stimulation in vitro with PMA and ionomycin, cytokine content of tonsil CD56+ cells was analyzed by flow cytometry. Data displayed are the frequencies of cytokine-positive cells within NKp44+CD103+ cells, ILC3 and NKp44CD103 cells obtained from 5 to 13 different donors. (D) Tonsil and peripheral blood CD56+ cells were cultured with IL-12, IL-15, IL-18, or with combinations of these cytokines. After 9 hours, tonsil NKp44+CD103+ cells, tonsil NKp44CD103 cells, blood CD56lo (CD3CD16+CD56lo) and blood CD56hi (CD3CD16CD56hi) cells were analyzed for IFN-γ content. (E) Cytotoxic potential of NKp44+ cells was analyzed by intracellular staining for granzymes and perforin. Gray profiles indicate the ILC3 subset; black lines denote NKp44+CD103+ cells. (F) Frequency of CD107a+ cells following co-culture of ILC subsets with K562. Shown are combined results obtained from 7 individual donors. Data are represented as mean +/- SD.
Figure 2
Figure 2. see also Figure S2. Expression of adhesion molecules, markers of TGF-β imprinting and activation in NKp44+CD103+ILC1
(A-D) CD56+ cells enriched from tonsils were analyzed for surface markers gating on live CD3 CD19 cells. Red lines indicate NKp44+CD103+ ILC1, blue lines denote ILC3 (NKp44+CD103), and black lines indicate NKp44CD103 cells. Representative data from experiments with 3 or more individual tonsil samples are shown. (E) Tonsil CD56+ cells were sorted into the three subsets described in (A-D), and mRNA content for NEDD9 and ITGAE (encoding CD103) was analyzed by qRT-PCR. Displayed are normalized data from qRT-PCR experiments with 3 (NEDD9), and 5 (ITGAE) individual donors. Data are represented as mean +/- SD. (F) NKp44+CD103+ cells were sorted from tonsils, cultured in IL-15 with or without the addition of TGF-β for 9 days and analyzed for CD103 and NKp44 expression. (G) Tonsil CD56+ cells were analyzed for surface expression of activation markers as in (A-D).
Figure 3
Figure 3. NKp44+CD103+cells express T-bet, Eomes and Aiolos
(A) Tonsil CD56+ cells were stained for intracellular T-bet, RORγt, Helios, and FoxP3. Dark gray profiles indicate ILC3, black lines represent NKp44+CD103+ ILC1, and dotted lines indicate NKp44CD103 cells. Light gray profiles indicate staining with isotype-matched control antibody. Representative data from 3 individual tonsil samples are shown. (B) Tonsil CD56+ cells were sorted into the three subsets described in (A), and mRNA content for AHR, IKZF3 (encoding Aiolos) and EOMES was analyzed by qRT-PCR. Displayed are normalized data from 4 (AHR), 9 (IKZF3), and 5 (EOMES) donors. Data are represented as mean +/- SD.
Figure 4
Figure 4. Activation of NKp44+CD103+cells by co-culture with epithelial cells and myeloid cells stimulated with TLR agonists
(A-B) Tonsil CD56+ cells were co-cultured for 9 hours with the colon carcinoma cell line Colo-205 that was pre-treated with poly I:C or Pam3CSK4. IFN-γ content of NKp44+CD103+ ILC1 was determined by intracellular staining. (A) Staining from one representative experiment. (B) Compiled data from four experiments, showing the percentage of IFN-γ cells within the NKp44+CD103+ ILC1. (C-D) Tonsil NKp44+CD103+ cells were FACS sorted and co-cultured for 48 hours with Colo-205 cells that were left unstimulated or treated with Pam3CSK4. IFN-γ levels in culture supernatants were determined by CBA. (C) Representative results from one experiment. (D) Summary of experiments with 3 donors, showing IFN-γ levels produced by NKp44+CD103+ cells of individual donors. (E-F) Tonsil CD56+ cells were co-cultured for 9 hours with peripheral blood CD14+ monocytes (E) or monocyte-derived dendritic cells (F) pre-treated with poly I:C or Pam3CSK4. IFN-γ content of NKp44+CD103+ cells was determined by intracellular staining.
Figure 5
Figure 5. see also Figure S3. NKp44+CD103+ILC1 in normal and CD intestinal mucosa
(A-B) Intraepithelial lymphocytes (IEL) and lamina propria lymphocytes (LPL) of human small intestine (A) and colon (B) were stained for CD103 and several ILC1 markers. Cells were gated on live CD45+CD3 lymphocytes. Shown are representative data from 2-3 different individuals. (C) Serial frozen sections from human appendix were stained for NKp44 (brown, left panel), CD103 (brown, middle panel), and CD3 (brown, right panel). Cells expressing both NKp44+, CD103+ within the surface epithelium (SE) are indicated (arrows). Sections are counterstained with haematoxylin. (D) Fixed sections from human appendix (left) and small intestinal villi (right) were stained for CD3 (blue) and T-bet (brown). T-bet+CD3 are indicated (arrows). (E) Samples from ileal resections of CD patients (CD) and non-IBD controls (NC) were analyzed for the ratio of NKp44+CD103+ cells versus CD3+ T cells within CD45+ IEL.
Figure 6
Figure 6. see also Figure S4. Phenotype, function and developmental requirements of murine intraepithelial ILC1
(A) Small intestine IEL of Rag-1-/- mice were analyzed for the expression of NKp46, NK1.1 and CD160. The majority of NKp46+NK1.1+ IEL (histogram, black line) express CD160, while NKp46+NK1.1 ILC3 (histogram, gray profile) do not. Control staining of NKp46+NK1.1+ cells is indicated by a dotted line. Cells in the dot plots were gated on live lymphocytes. (B) IEL from Rag-1-/- mice were stimulated in vitro with IL-12 and IL-15 and analyzed for intracellular IFN-γ. Cells were gated on CD45+NK1.1+ cells. (C) IEL from C57BL/6 mice were stimulated in vitro with a combination of IL-12 and IL-15, or with IL-23 and IL-1β, and analyzed for intracellular IFN-γ. Cells were gated on CD45+CD3NKp46+ cells. (D) Frequencies of intraepithelial ILC1 in the small intestine of Nfil3-/-, Ahr-/-, Tbx21-/- and Rorc-/- mice and littermate controls. Cells were gated on CD45+CD3CD19. (E) Small intestinal IEL of conventionally housed (SPF) or germ-free C57BL/6 mice, as well as of adult and neonate C57BL/6 mice, were analyzed for the presence of NKp46+NK1.1+ cells. Cells were gated on CD45+CD3CD19. (F) ILC1 within IEL are largely preserved in Il15ra-/- mice. Left, frequencies of NKp46+NK1.1+ cells within spleen and intestinal IEL (gated on CD45+CD3CD19) from wild-type and IL15ra-/- mice from experiments with four mice each. Data are represented as mean +/- SD. Right, representative dot plots from IEL from wild-type and IL15ra-/- mice. (G) ILC1 from small intestinal epithelium of wild-type (black line) and IL15ra-/- mice (dotted line) express similar levels of CD160. Cells were gated on CD45+CD3CD19, followed by gating on NKp46+NK1.1+ cells. The gray profile indicates CD160 on wild-type splenic NKp46+NK1.1+ cells.
Figure 7
Figure 7. see also Figure S5. Intraepithelial ILC1 produce IFN-γ and contribute to pathology during anti-CD40-induced colitis
(A) Rag-1-/- mice were left untreated or injected with anti-CD40 to induce colitis. 36 hours after injection, small intestinal IEL were isolated and IFN-γ content of ILC1 (top panel) ILC3 cells (bottom panel), gated as shown in Figure 6A, was determined by intracellular staining. (B-C) ILC1 contribute to the intestinal pathology during anti-CD40-induced colitis. Rag-1-/- mice were treated with anti-NK1.1 to deplete intraepithelial ILC1, and colitis was induced with anti-CD40. Intestinal tissue pathology in the proximal colon was analyzed on day 7 after anti-CD40 treatment. Control, mice injected with anti-CD40 without anti-NK1.1 treatment. (B) Weight of mice recorded as the percentage of initial weight. Data are represented as mean +/- SD. (C) Left, H&E staining of proximal colon sections at day 7 after anti-CD40 injection, showing more severe cellular infiltration in control mice compared to anti-NK1.1-treated mice. Right, colitis score at day 7 determined from H&E staining of proximal colon samples. Data are represented as mean +/- SD.

Comment in

References

    1. Allez M, Brimnes J, Dotan I, Mayer L. Expansion of CD8+ T cells with regulatory function after interaction with intestinal epithelial cells. Gastroenterology. 2002;123:1516–1526. - PubMed
    1. Buonocore S, Ahern PP, Uhlig HH, Ivanov II, Littman DR, Maloy KJ, Powrie F. Innate lymphoid cells drive interleukin-23-dependent innate intestinal pathology. Nature. 2010;464:1371–1375. - PMC - PubMed
    1. Carman PS, Ernst PB, Rosenthal KL, Clark DA, Befus AD, Bienenstock J. Intraepithelial leukocytes contain a unique subpopulation of NK-like cytotoxic cells active in the defense of gut epithelium to enteric murine coronavirus. J Immunol. 1986;136:1548–1553. - PubMed
    1. Casey KA, Fraser KA, Schenkel JM, Moran A, Abt MC, Beura LK, Lucas PJ, Artis D, Wherry EJ, Hogquist K, et al. Antigen-independent differentiation and maintenance of effector-like resident memory T cells in tissues. J Immunol. 2012;188:4866–4875. - PMC - PubMed
    1. Cauley LS, Lefrancois L. Guarding the perimeter: protection of the mucosa by tissue-resident memory T cells. Mucosal Immunol. 2013;6:14–23. - PMC - PubMed

Publication types