Review
. 2013 Apr:229:187-97.
doi: 10.1016/j.jmr.2013.02.003. Epub 2013 Feb 8.

Strategies for rapid in vivo 1H and hyperpolarized 13C MR spectroscopic imaging

Affiliations
Review

Strategies for rapid in vivo 1H and hyperpolarized 13C MR spectroscopic imaging

Sarah J Nelson et al. J Magn Reson. 2013 Apr.

Abstract

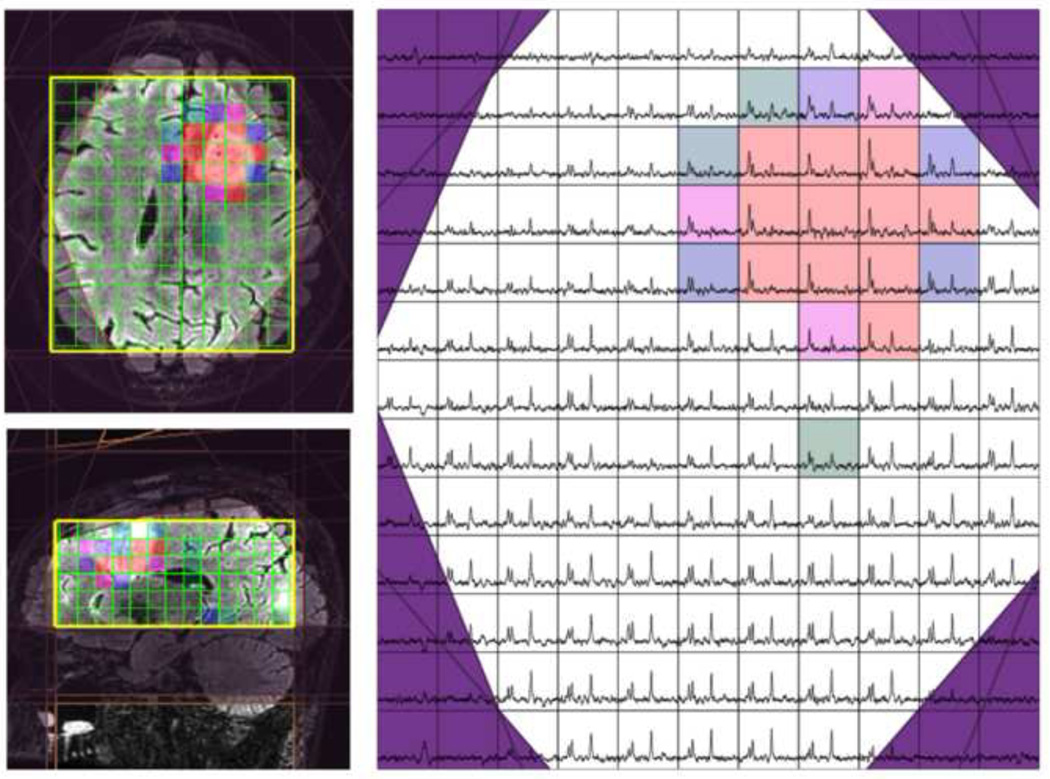
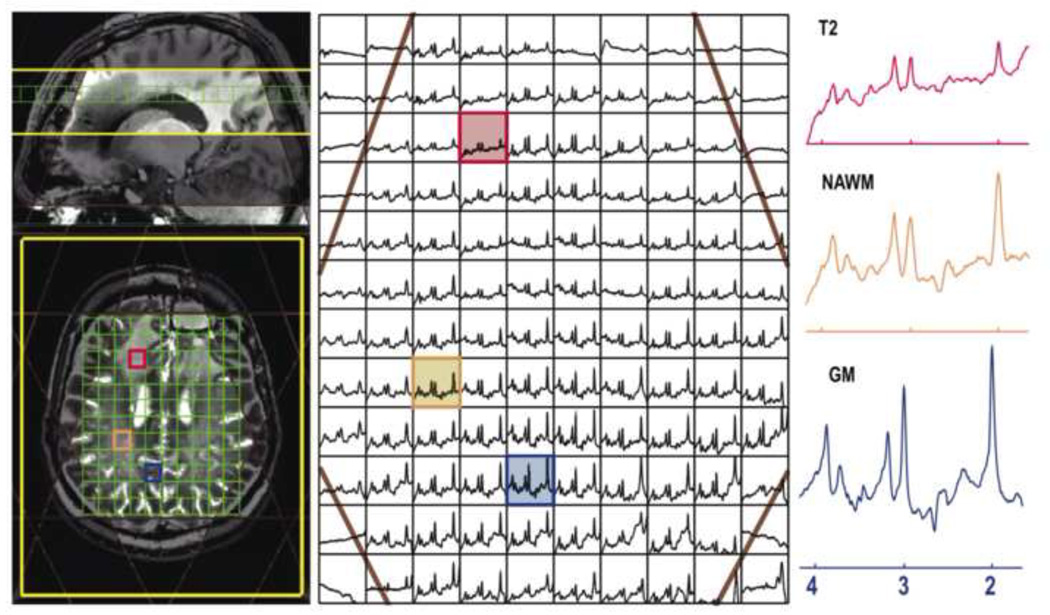
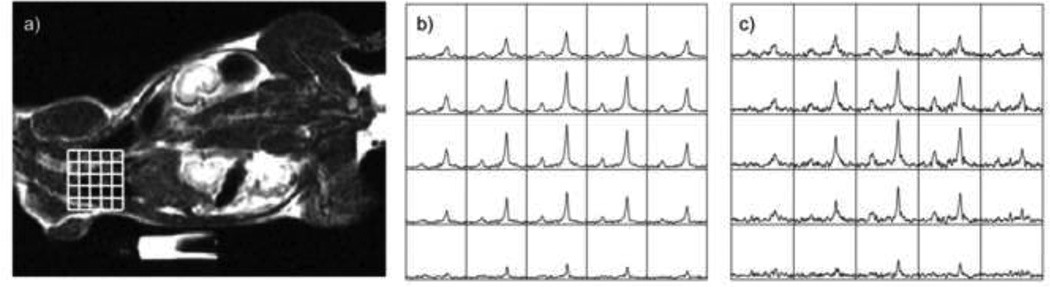
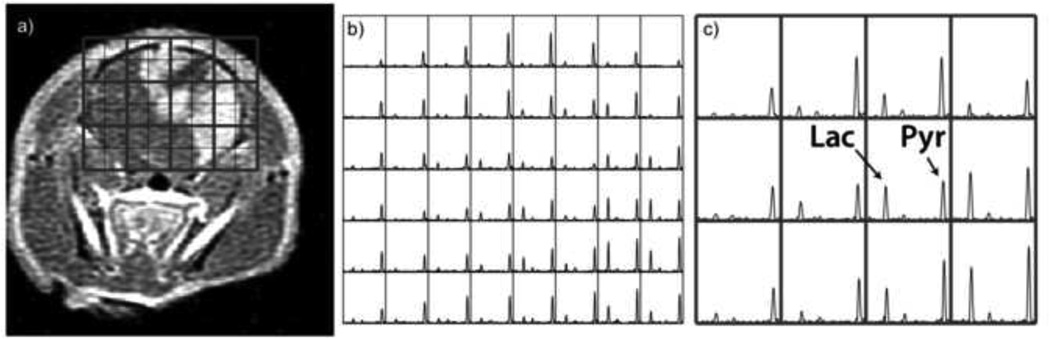
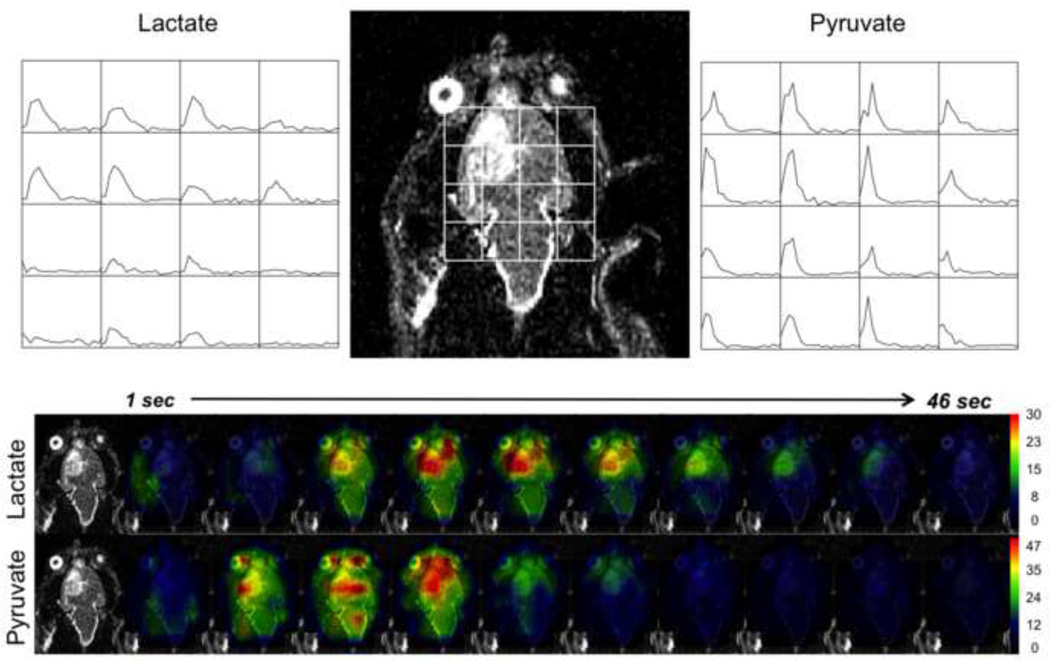
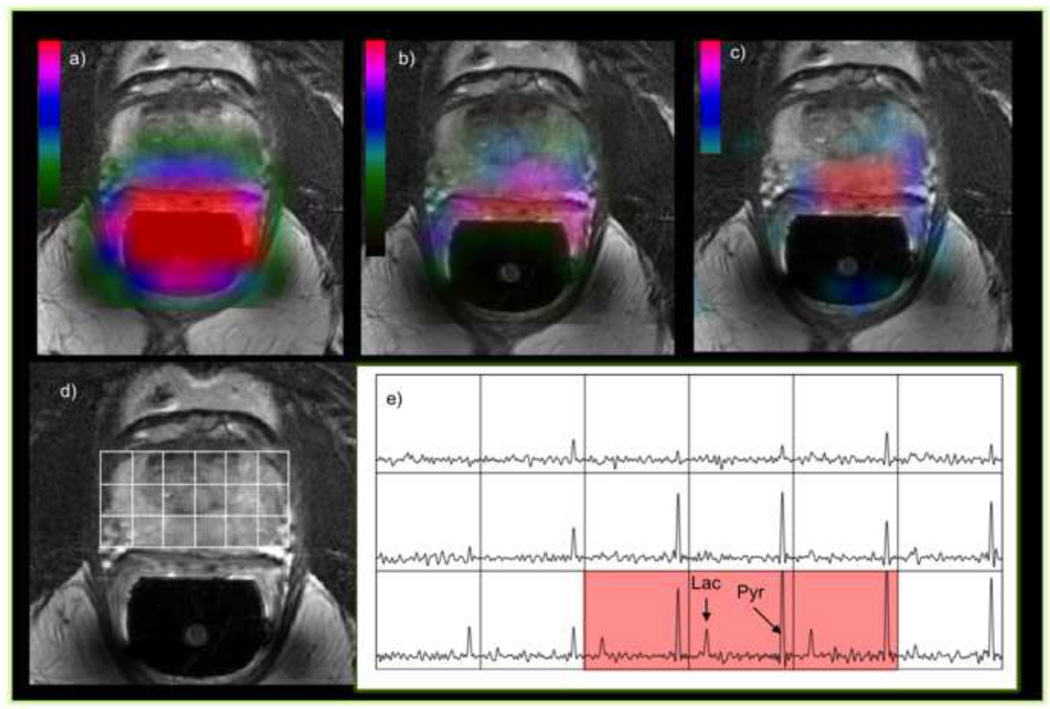
In vivo MRSI is an important imaging modality that has been shown in numerous research studies to give biologically relevant information for assessing the underlying mechanisms of disease and for monitoring response to therapy. The increasing availability of high field scanners and multichannel radiofrequency coils has provided the opportunity to acquire in vivo data with significant improvements in sensitivity and signal to noise ratio. These capabilities may be used to shorten acquisition time and provide increased coverage. The ability to acquire rapid, volumetric MRSI data is critical for examining heterogeneity in metabolic profiles and for relating serial changes in metabolism within the same individual during the course of the disease. In this review we discuss the implementation of strategies that use alternative k-space sampling trajectories and parallel imaging methods in order to speed up data acquisition. The impact of such methods is demonstrated using three recent examples of how these methods have been applied. These are to the acquisition of robust 3D (1)H MRSI data within 5-10 min at a field strength of 3 T, to obtaining higher sensitivity for (1)H MRSI at 7 T and to using ultrafast volumetric and dynamic (13)C MRSI for monitoring the changes in signals that occur following the injection of hyperpolarized (13)C agents.


Figures

Figure 1
Figure 1
Demonstration of the impact of the chemical shift artifact for 3D PRESS 1H MRSI volume selection acquired with the product sequence with a 180 degree pulse bandwidth of 936Hz: a) image showing the location of the volume and b) the corresponding spectral array (b) The chemical shift artifact is clearly seen on the top and bottom slices from the sagittal orientation. The lower row of images show c) the cross-section of a selected volume, the same volume obtained with OVERPRESS =1.2 d) without OVS, e) OVS bands that sharpen the edges and f) with additional graphically prescribed OVS bands that conform the volume to an octagon.
Figure 2
Figure 2
Flyback and Symmetric EPSI trajectories used for 1H MRSI data acquisitions with a 1cm nominal voxel size at 3T. On the bottom row shows the calibration images and a single voxel from data obtained from each channel of an 8-element head coil from a phantom, as well as the combined spectrum.
Figure 3
Figure 3
Demonstration of the impact of coil combination for in vivo results obtained with the same 8-element head coil as for the phantom in Figure 2. The improvement in signal to noise ratio is clearly seen for the combined spectral array.
Figure 4
Figure 4
Application of elliptical SENSE for 3D 1H MRSI obtained from the brain using an *8-element head coil. The array on the left b) was fully sampled with an acquisition time of 17minutes and the one on the right c) uses SENSE with an R=4 factor (2 in RL and 2 in AP) with an acquisition time of 5 minutes. The shaded voxels highlight the region that has abnormal metabolite levels.
Figure 5
Figure 5
3D 1H MRSI data obtained with PRESS localization, TE=144ms using the fully automated prescription strategy described by Ozhinsky et al (43) and displayed using the SIVIC package (44). The colored voxels represent areas with elevated choline and decreased NAA. The purples lines represent the location of VSS bands.
Figure 6
Figure 6
One slice from a 3D MRSI dataset from a patient with anaplastic astrocytoma (TE/TR = 30/2000 ms; spectral array = 18×22×8; nominal spatial resolution = 1 cm3; total acquisition time ∼ 10 min). Note that the baseline has not been removed from the spectra that are shown. Eight VSS bands were prescribed automatically based on the position of the selected slice. The voxel labeled as T2 comes from the region of hyperintensity on the T2-weighted image, the voxel marker WM is from normal appearing white matter and the voxel labeled GM is from normal appearing grey matter.
Figure 7
Figure 7
Examples of 13C MRSI data obtained following injection of hyperpolarized 13C pyruvate. a) image and MRSI data obtained from the heart of a rat using b) fully sampled data and c) data reconstructed with SENSE in order to improve the spatial resolution by a factor of 2. The rf coil used had 3 element in the RL direction. The total acquisition time was 15s.
Figure 8
Figure 8
Application of compressed sensing with a speed-up factor of b) 4 and c) fully sampled hyperpolarized 13C MRSI data that were acquired from the brain of a rat with an implanted U87 tumor.
Figure 9
Figure 9
Dynamic 13C EPSI data with a time resolution of 3s from the brain of a rat with an implanted tumor obtained following injection of hyperpolarized 13C pyruvate. The arrays of dynamic curves from lactate and pyruvate cover a 45s time period starting from the end of the injection. The color overlay images represent the spatial distribution of changes in levels of lactate and pyruvate during the same period. These data were displayed using the SIVIC package (44).
Figure 10
Figure 10
Some of the first 3-D MRSI data obtained with 1-D EPSI and 2 directions of phase encoding from a patient with prostate cancer. The left-most color overlay a) is the profile of the dual 1H/13C endorectal coil used for reception of the signals, the middle overlay b) is of pyruvate and the right most c) is of lactate. The reference image d) and spectral array e) show a portion of the 3D array that covers the tumor region. The voxels highlighted in red have lactate/pyruvate ratio that is indicative of tumor. The acquisition time for this 3D array was 12s, the matrix was 18×8×8 with a 7mm spatial resolution, a progressive flip angle, TE/TR=3/85-125ms, starting at 28s after the end of the injection of a dose of 0.43mL/Kg of hyperpolarized pyruvate.

References

    1. Nelson SJ. Analysis of volume MRI and MR spectroscopic imaging data for the evaluation of patients with brain tumors. Magn Reson Med. 2001;46:228–239. - PubMed
    1. Kaiser LG, Young K, Matson GB. Elimination of spatial interference in PRESS-localized editing spectroscopy. Magn Reson Med. 2007 Oct;58(4):813–818. - PubMed
    1. Park I, Chen AP, Zierhut ML, Ozturk-Isik E, Vigneron DB, Nelson SJ. Implementation of 3 T lactate-edited 3D 1H MR spectroscopic imaging with flyback echo-planar readout for gliomas patients. Ann Biomed Eng. 2011 Jan;39(1):193–204. - PMC - PubMed
    1. Star-Lack J, Vigneron DB, Pauly J, Kurhanewicz J, Nelson SJ. Improved solvent suppression and increased spatial excitation bandwidths for three-dimensional PRESS CSI using phase-compensating spectral/spatial spin-echo pulses. J Magn Reson Imaging. 1997 Jul-Aug;7(4):745–757. - PubMed
    1. Adalsteinsson E, Irarrazabal P, Topp S, Meyer C, Macovski A, Spielman DM. Volumetric spectroscopic imaging with spiral-based k-space trajectories. Magn Reson Med. 1998 Jun;39(6):889–898. - PubMed