. 2013 Apr 11;50(1):43-55.
doi: 10.1016/j.molcel.2013.01.037. Epub 2013 Feb 28.

MEK1 is required for PTEN membrane recruitment, AKT regulation, and the maintenance of peripheral tolerance

Affiliations

MEK1 is required for PTEN membrane recruitment, AKT regulation, and the maintenance of peripheral tolerance

Katarina Zmajkovicova et al. Mol Cell. .

Abstract

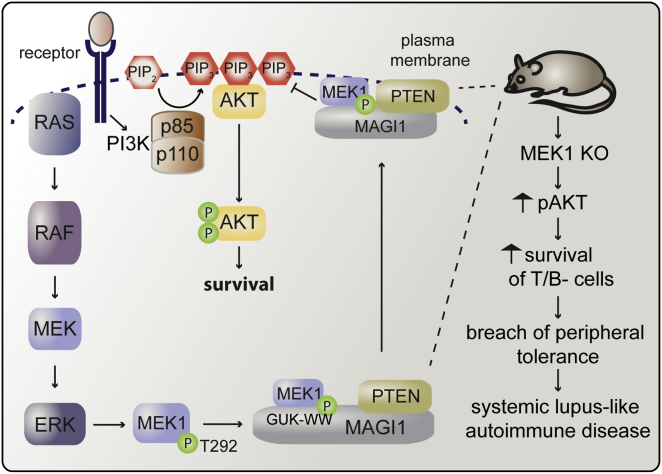
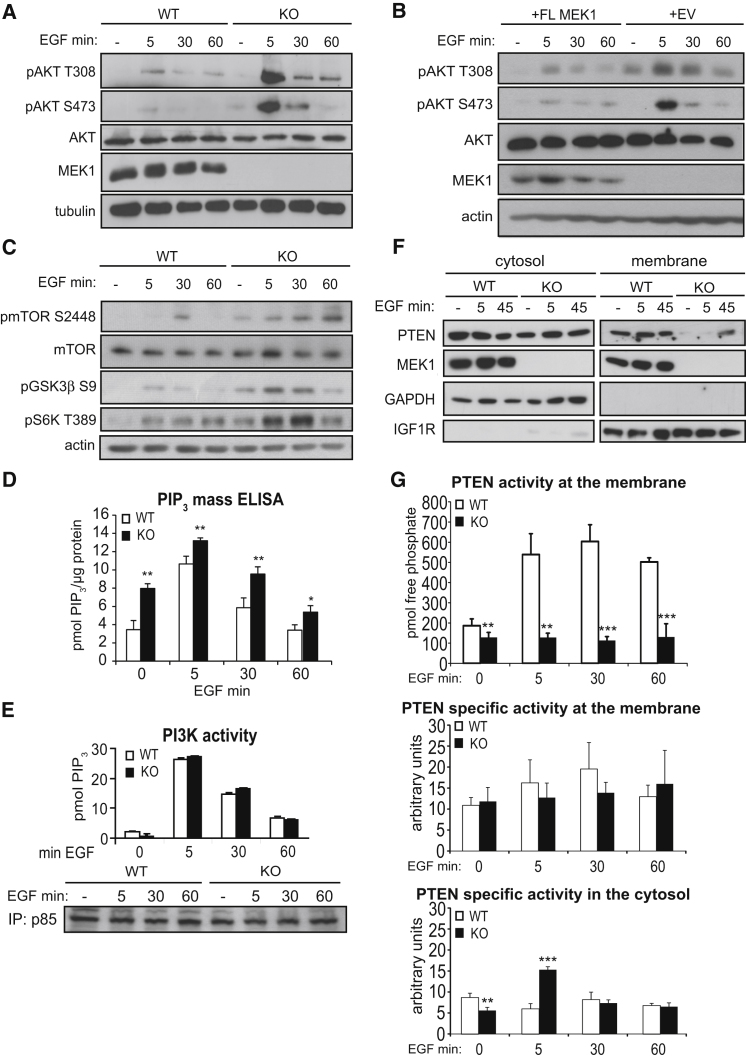
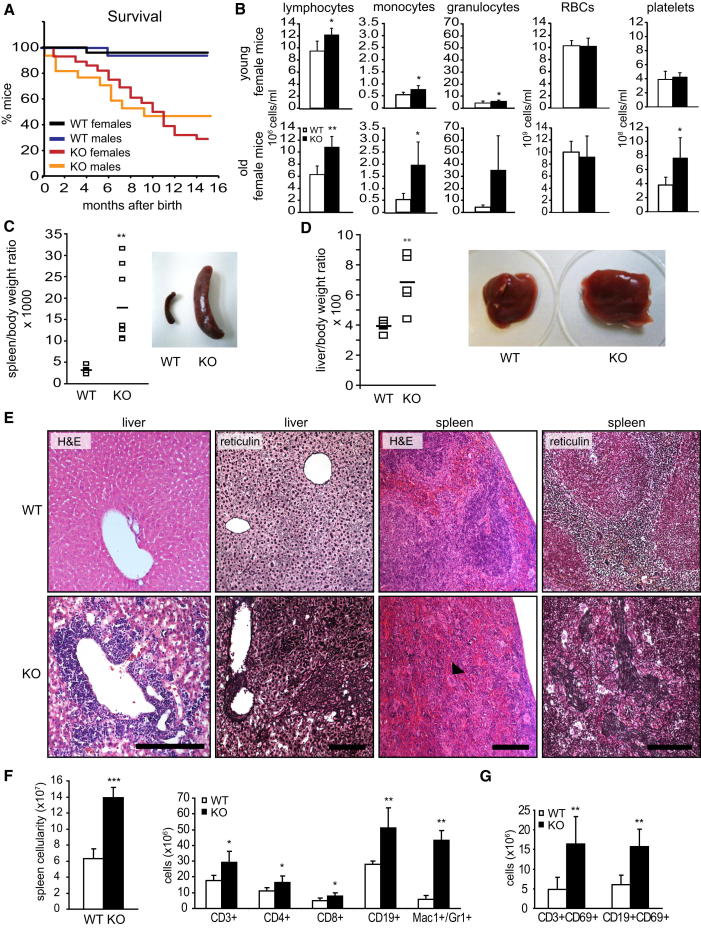
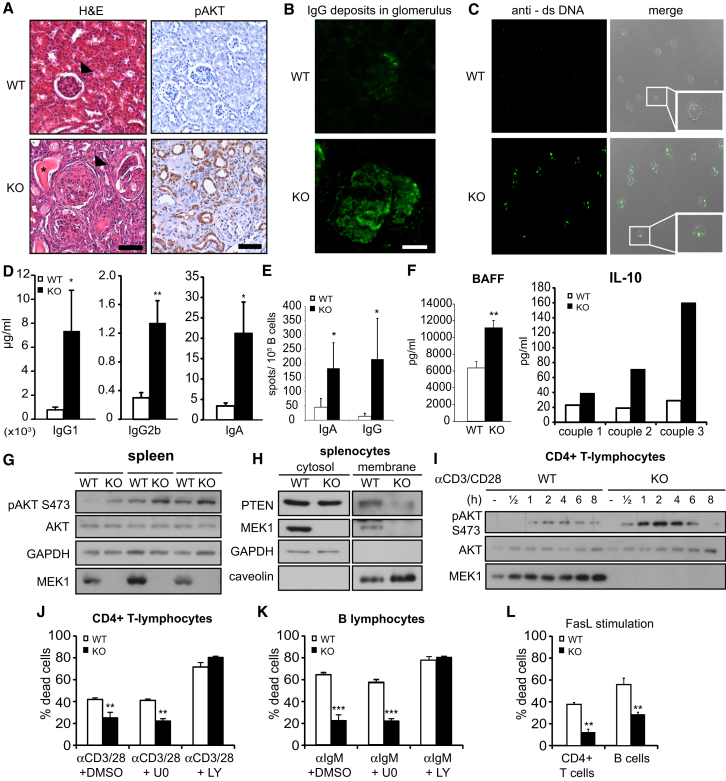
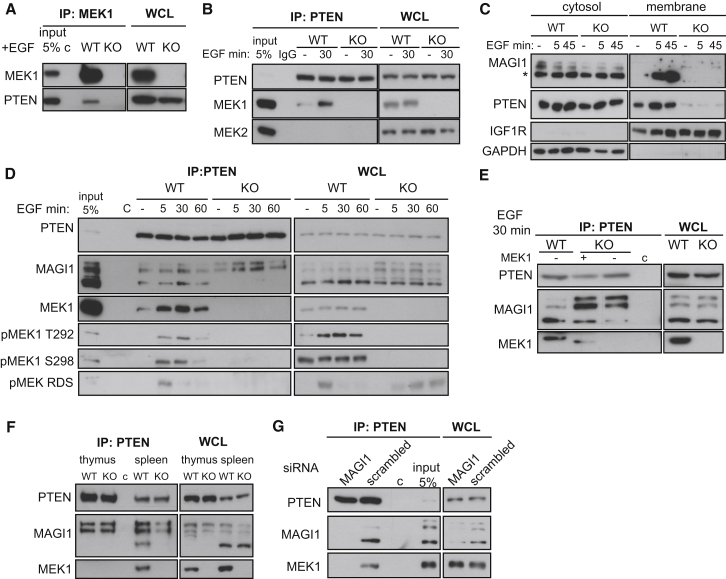
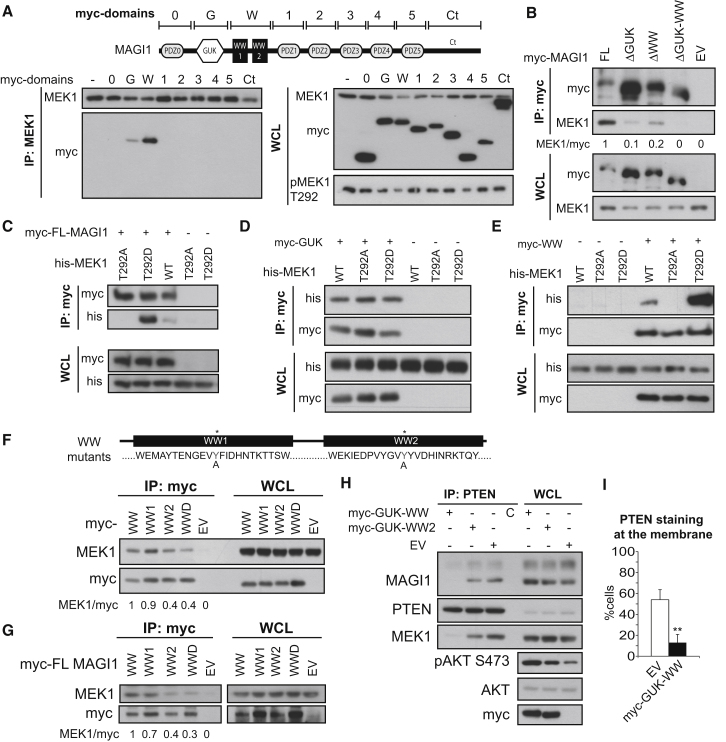
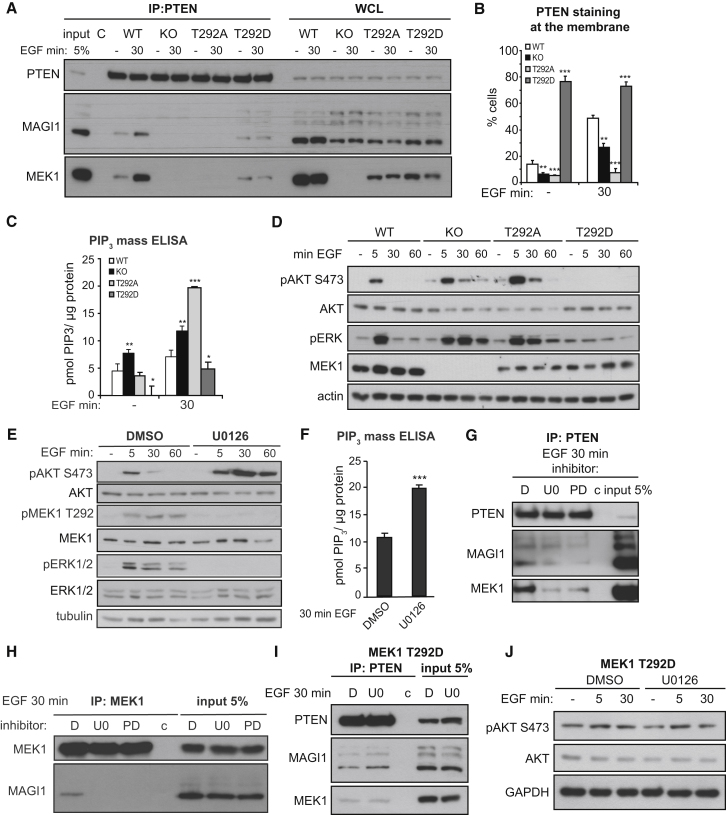
The Raf/MEK/ERK and PI3K/Akt pathways are prominent effectors of oncogenic Ras. These pathways negatively regulate each other, but the mechanism involved is incompletely understood. We now identify MEK1 as an essential regulator of lipid/protein phosphatase PTEN, through which it controls phosphatidylinositol-3-phosphate accumulation and AKT signaling. MEK1 ablation stabilizes AKT activation and, in vivo, causes a lupus-like autoimmune disease and myeloproliferation. Mechanistically, MEK1 is necessary for PTEN membrane recruitment as part of a ternary complex containing the multidomain adaptor MAGI1. Complex formation is independent of MEK1 kinase activity but requires phosphorylation of T292 on MEK1 by activated ERK. Thus, inhibiting the ERK pathway reduces PTEN membrane recruitment, increasing phosphatidylinositol-3-phosphate accumulation and AKT activation. Our data offer a conceptual framework for the observation that activation of the PI3K pathway frequently mediate resistance to MEK inhibitors and for the promising results obtained by combined MEK/PI3K inhibition in preclinical cancer models.


Figures

None
Graphical abstract
Figure 1
Figure 1
MEK1 Ablation Promotes PIP3 Signaling by Preventing PTEN Membrane Translocation (A–C) WT and KO MEFs (A and C), and KO MEFs reconstituted with full-length MEK1 (+FL MEK1) or empty vector (+EV) (B) were stimulated with EGF and lysed at the indicated time points. Proteins and phosphorylated proteins were detected by immunoblotting as indicated. (D) ELISA measurement of cellular PIP3 in MEFs upon EGF stimulation. (E) PI3K activity in p85 IPs from untreated or EGF-stimulated MEFs was assessed by ELISA. The amount of PIP3 was normalized to the amount of immunoprecipitated p85. (F) Extracts of starved or EGF-stimulated MEFs separated into cytosolic and membrane fractions. The presence of PTEN, MEK1, GAPDH (cytosolic marker), and IGF1R (plasma membrane marker) was assessed by immunoblotting. (G) PTEN activity in membrane and cytosol fractions of EGF-stimulated MEFs. In the middle and bottom panels, arbitrary units were calculated by division of picomoles of released phosphate by the amount of immunoprecipitated PTEN determined by the densitometry of western blots. The values in (D), (E), and (G) represent the mean of three experiments ±SD. p < 0.05; ∗∗p < 0.01; ∗∗∗p < 0.001. See also Figure S1.
Figure 2
Figure 2
Myeloproliferation and Lymphocyte Activation in MEK1 KO Mice (A) Survival of female (n = 28) and male (n = 17) KO mice monitored over a 15 month period. (B) Peripheral blood cell counts of young (1–3 months) and old (8–12 months) female KO mice and sex-matched WT littermates. Values represent mean ±SD (n = 5). (C and D) Spleno- and hepatomegaly in MEK1 KO mice. The plots show the weight of spleens (C; n = 6) and livers (D; n = 5) isolated from affected mice. (E) Effacement of tissue architecture, extramedullary hematopoiesis (hematoxylin and eosin staining; arrowhead, giant megakaryocyte) and fibrosis in KO livers and spleens. Scale bars represent 200 μm. (F and G) Increased Mac1+/Gr1+ cells and activated lymphocytes in spleens of affected KO mice (age 5–12 months, n = 5), detected by FACS analysis of lineage-specific and activation-induced markers (G; CD69). Values represent mean ±SD (n = 5). p < 0.05; ∗∗p < 0.01; ∗∗∗p < 0.001. See also Figure S2.
Figure 3
Figure 3
MEK1 Ablation Leads to Systemic Autoimmune Disease (A) Enlarged glomeruli (arrows), tubules filled with proteinaceous material (asterisk), and increased pAKT in KO kidneys. Scale bars represent 100 μm. (B) Immune complex deposition in the glomerulus of a 10-month-old KO female visualized by mouse IgG antibodies (green). The scale bar represents 30 μm. (C) dsDNA autoantibodies detected in the serum of KO mice (5–10 months, n = 7) by Crithidia luciliae kinetoplast staining. (D) IgG1, IgG2b, and IgA levels in the sera of 8- to 10-month-old mice (n = 3) assessed by ELISA. (E) Frequency of B cells secreting IgA and IgG in 8- to 10-month-old mice determined by ELISpot (n = 4). Error bars represent the SD. (F) BAFF and IL-10 serum levels determined as in (D). (G) AKT phosphorylation and expression of AKT, MEK1, and GAPDH (loading control) were determined in lysates of 8-week-old WT and KO spleens. (H) PTEN, MEK1, GAPDH (cytosolic marker), and caveolin (membrane marker) detected by immunoblotting in subcellular fractions of freshly isolated WT and KO splenocytes. (I) Splenic CD4+ T cells stimulated with anti-CD3 and anti-CD28 (3 μg/ml each). The indicated proteins were visualized by immunoblotting. (J–L) Survival of CD4+ T cells and B cells in response to AICD and FasL-induced cell death. Values represent the mean of three experiments ±SD. p < 0.05; ∗∗p < 0.01; ∗∗∗p < 0.001. See also Figure S3.
Figure 4
Figure 4
A MEK1/MAGI1/PTEN Ternary Complex Regulates MAGI1 and PTEN Membrane Recruitment (A and B) MEK1 (A) or PTEN (B) IPs prepared from EGF-stimulated WT and KO MEFs. MEK1, MEK2, and PTEN were detected by immunoblotting. WCL, whole-cell lysates; c, unspecific binding to beads or isotype control antibody (IgG). (C) Translocation of MAGI1100 () and PTEN to the membrane. MAGI1, PTEN, IGF1R (membrane marker), and GAPDH (cytosolic marker) detected by immunoblotting of cytosol and membrane fractions of EGF-stimulated MEFs. (D) PTEN, MAGI1, MEK1, and pMEK1 (pS298, pT292, and Raf-dependent sites, pRDS) detected by immunoblotting in WCL and PTEN IPs from EGF-stimulated MEFs. (E) PTEN was immunoprecipitated from EGF-stimulated (30 min) WT and KO MEFs. Recombinant MEK1 (rMEK1; 1 μg) was added to the KO lysate as indicated. rMEK1 lacks 34 N-terminal amino acids and runs faster than endogenous MEK1. (F) WCL and PTEN IPs from WT and KO thymocytes and splenocytes immunoblotted with PTEN, MAGI1, and MEK1 antibodies. (G) WT MEFs transfected with small interfering RNA (siRNA) against MAGI1 or control siRNA (scrambled). PTEN, MAGI1, and MEK1 were detected by immunoblotting of WCL and PTEN IPs from EGF-stimulated cells (30 min) MEFs. See also Figure S4.
Figure 5
Figure 5
Structure-Function Analysis of MEK1/MAGI1 Complexes COS7 cells continuously growing in the presence of serum were transiently transfected with the indicated constructs. (A) myc-tagged MAGI1 domains (schematically depicted in the upper panel) in endogenous MEK1 IPs and WCL were detected by immunoblot. (B) myc-tagged MAGI1 and endogenous MEK1 were detected in myc-tag IPs and WCL of cells transfected with myc-tagged MAGI1 deletion mutants. (C–E) myc-tagged MAGI1 proteins and His-tagged MEK1 were detected in myc-tag IP and WCL of cells transfected with His-tagged WT or mutant MEK1 and myc-tagged full-length MAGI1 (C), GUK (D), or WW (E) domains. Lysates were subjected to immunoblotting with His and myc antibodies. (F and G) myc-tagged MAGI1 proteins and endogenous MEK1 were detected by immunoblotting in myc-tag IPs and in lysates of cells transfected with WT or mutant WW domains of MAGI1 (1, 2, and D, double mutant; F) or full-length MAGI1 bearing the same mutations (G). EV, empty vector. (H and I) COS7 cells transfected with a plasmid encoding the WT or mutated GUK-WW domains of MAGI1 or EV were subjected to PTEN IP (H). The indicated antigens were detected by immunoblotting. PTEN membrane localization was assessed by immunofluorescence (I; n = 3). Values represent mean ± SD. ∗∗p < 0.01. The numbers in (B), (F), and (G) indicate the ratio between MEK1:myc-MAGI1 proteins, measured by densitometry. The MEK1:WT myc-MAGI1 ratio is set as 1.
Figure 6
Figure 6
T292 Phosphorylation, but Not MEK1 Kinase Activity, Promotes MEK1/MAGI1/PTEN Binding and Decreases PIP3 Pathway Activation (A) WT, KO, and MEK1 mutant fibroblasts were stimulated with EGF. PTEN, MAGI1, and MEK1 in endogenous PTEN IPs and WCL were detected by immunoblotting. (B–D) MEK1 WT, KO, and mutant fibroblasts were stimulated with EGF. PTEN membrane recruitment was determined by immunofluorescence. The plot in (B) depicts the percentage of cells showing membrane PTEN. The plot in (C) shows PIP3 levels, determined by ELISA. pAKT, pERK, AKT, MEK, and tubulin (loading control) were detected by immunoblotting (D). (E and F) WT MEFs were pretreated with MEK inhibitors or DMSO and stimulated with EGF. Phosphorylation and expression of AKT, ERK, MEK1, and tubulin (loading control) were determined by immunoblotting (E). Intracellular PIP3 levels in WT MEFs pretreated with U0126 or DMSO and stimulated with EGF were measured by ELISA (F). (G and H) WT fibroblasts pretreated with DMSO or MEK inhibitors (U0126, PD0325901) and stimulated with EGF were subjected to PTEN (G) or MEK1 IP (H). PTEN, MAGI1, and MEK1 were detected by immunoblotting. c, nonspecific binding to the beads. (I and J) T292D MEK1 mutant MEFs were treated with U0126 or DMSO and stimulated with EGF. PTEN, MEK1, and MAGI1 in PTEN IPs (I) and pAKT, AKT, and GAPDH (loading control) in WCL (J) were visualized by immunoblotting. In (J), c represents nonspecific binding to the beads. The values in (B), (C), and (F) show the mean of three experiments ±SD. p < 0.05; ∗∗p < 0.01; ∗∗∗p < 0.001. See also Figure S5.

References

    1. Bélanger L.F., Roy S., Tremblay M., Brott B., Steff A.M., Mourad W., Hugo P., Erikson R., Charron J. Mek2 is dispensable for mouse growth and development. Mol. Cell. Biol. 2003;23:4778–4787. - PMC - PubMed
    1. Berger M.F., Lawrence M.S., Demichelis F., Drier Y., Cibulskis K., Sivachenko A.Y., Sboner A., Esgueva R., Pflueger D., Sougnez C. The genomic complexity of primary human prostate cancer. Nature. 2011;470:214–220. - PMC - PubMed
    1. Bissonauth V., Roy S., Gravel M., Guillemette S., Charron J. Requirement for Map2k1 (Mek1) in extra-embryonic ectoderm during placentogenesis. Development. 2006;133:3429–3440. - PubMed
    1. Bonifant C.L., Kim J.S., Waldman T. NHERFs, NEP, MAGUKs, and more: interactions that regulate PTEN. J. Cell. Biochem. 2007;102:878–885. - PMC - PubMed
    1. Borlado L.R., Redondo C., Alvarez B., Jimenez C., Criado L.M., Flores J., Marcos M.A., Martinez-A C., Balomenos D., Carrera A.C. Increased phosphoinositide 3-kinase activity induces a lymphoproliferative disorder and contributes to tumor generation in vivo. FASEB J. 2000;14:895–903. - PubMed

Publication types

MeSH terms