. 2013 Mar 18;23(6):523-8.
doi: 10.1016/j.cub.2013.02.018. Epub 2013 Feb 28.

Evolution of mir-92a underlies natural morphological variation in Drosophila melanogaster

Affiliations

Evolution of mir-92a underlies natural morphological variation in Drosophila melanogaster

Saad Arif et al. Curr Biol. .

Abstract

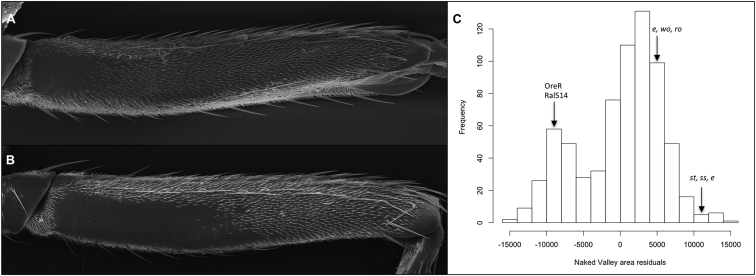
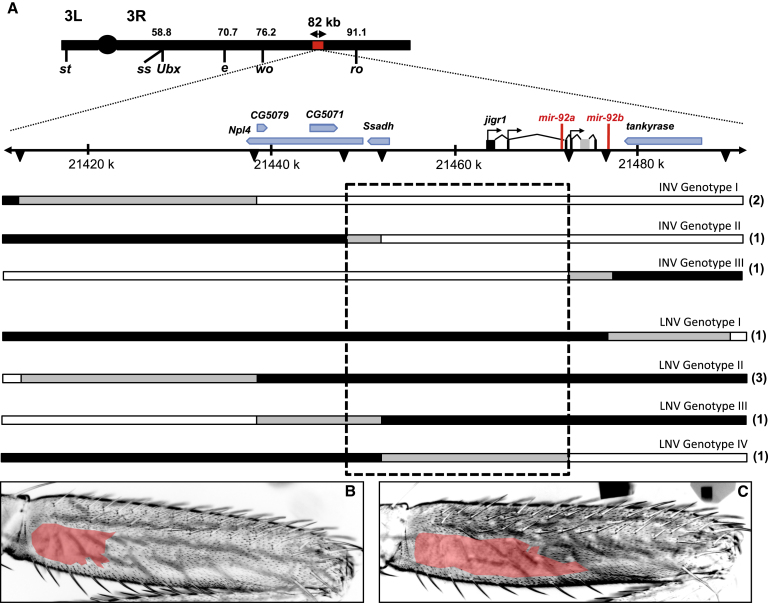
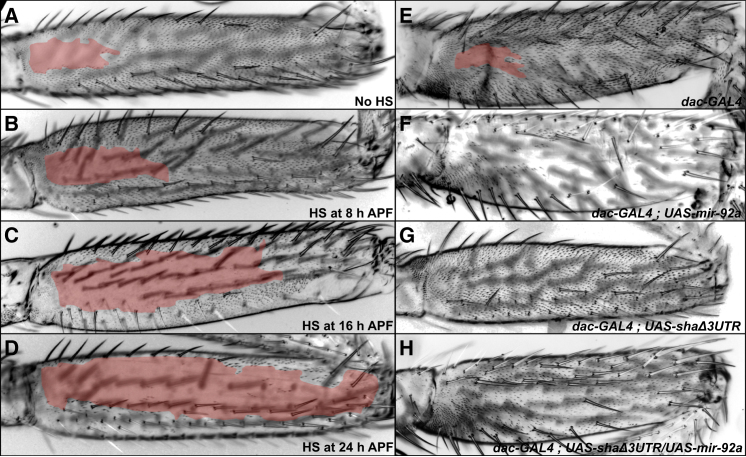
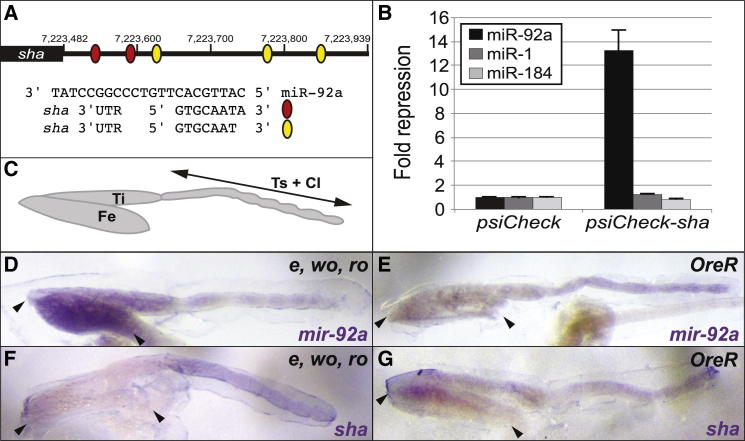
Identifying the genetic mechanisms underlying phenotypic change is essential to understanding how gene regulatory networks and ultimately the genotype-to-phenotype map evolve. It is recognized that microRNAs (miRNAs) have the potential to facilitate evolutionary change [1-3]; however, there are no known examples of natural morphological variation caused by evolutionary changes in miRNA expression. Therefore, the contribution of miRNAs to evolutionary change remains unknown [1, 4]. Drosophila melanogaster subgroup species display a portion of trichome-free cuticle on the femur of the second leg called the "naked valley." It was previously shown that Ultrabithorax (Ubx) is involved in naked valley variation between D. melanogaster and D. simulans [5, 6]. However, naked valley size also varies among populations of D. melanogaster, ranging from 1,000 up to 30,000 μm(2). We investigated the genetic basis of intraspecific differences in the naked valley in D. melanogaster and found that neither Ubx nor shavenbaby (svb) [7, 8] contributes to this morphological difference. Instead, we show that changes in mir-92a expression underlie the evolution of naked valley size in D. melanogaster through repression of shavenoid (sha) [9]. Therefore, our results reveal a novel mechanism for morphological evolution and suggest that modulation of the expression of miRNAs potentially plays a prominent role in generating organismal diversity.


Figures

Figure 1
Figure 1
Distribution of Naked Valley Sizes across D. melanogaster Populations (A and B) Posterior femurs of the second legs of D. melanogaster strains Oregon-R (A) and e, wo, ro (B). Proximal is to the left and distal to the right in both panels. (C) Bimodal frequency distribution of naked valley phenotypes (residuals of naked valley area regressed on femur length) of 679 male flies from isofemale lines of five populations sampled from Kenya, Turkey, Spain, and the USA. A minimum of three individuals were sampled for each isofemale line. Average values for strains Oregon-R, RAL514, e, wo, ro, and st, ss, e are indicated by arrows. See also Figure S1.
Figure 2
Figure 2
High-Resolution Mapping of the Causative Locus (A) The topmost black bar represents chromosome 3, with the two arms (3L and 3R) indicated either side of the centromere (circle). The position of Ubx and selected QTL markers are shown below the bar, with their positions in cM indicated above. The section of chromosome 3R highlighted by the red bar represents the 82.2 kb evolved region identified by the first mapping experiment (Figure S2C), which is shown expanded below, and between the dotted diagonal lines, with the scale given in kb. The bars below the scale indicate the genotypes of selected recombinants with breakpoints in the 82.2 kb region (note that all flies also carried a nonrecombinant chromosome from strain e, wo, ro that is not shown). Positions of molecular markers (Table S2) are indicated by black triangles. The number of individual flies representing each of the selected recombinant genotypes illustrated is given in parentheses to the right. Chromosomal regions from strains e, wo, ro (large naked valley parental line) and Oregon-R (small naked valley parental line) are indicated in black and white, respectively. Chromosomal regions in gray indicate DNA where the parental strain identity was not determined. The dashed black box indicates the 25 kb region that underlies naked valley variation. INV and LNV indicate intermediate and large naked valley phenotypes, respectively. (B and C) Representative examples of T2 posterior femurs from recombinant flies with either an INV (B) or LNV (C).
Figure 3
Figure 3
mir-92a Represses Trichome Development on the T2 Femur Uniform expression of mir-92a represses trichome formation progressively depending on developmental timing of overexpression induced by heat shock. Tan shading indicates the extent of trichome-free cuticle. See also Figure S3. (A–D) Posterior of T2 femurs of F1 flies from the cross between HS-GAL4 and UAS-mir-92a. (A) Posterior T2 femur of a control F1 fly that was not heat shocked. (B–D) F1 flies heat shocked at 8 hr (B), 16 hr (C), and 24 hr (D) after puparium formation (APF). (E) Posterior T2 femur of the dac-GAL4 control line. (F) UAS-mir-92a expression driven by dac-GAL4 represses trichome formation throughout the posterior femur. (G) UAS-shaΔ3UTR driven by dac-GAL4 results in the development of ectopic trichomes and removes the naked valley. (H) Simultaneous overexpression of UAS-shaΔ3UTR and UAS-mir-92a using dac-GAL4 leads to rescue of trichome formation and removes the naked valley.
Figure 4
Figure 4
Differential Expression of mir-92a Underlies Naked Valley Variation through Repression of sha (A) The sha 3′ UTR contains five highly conserved, canonical seed-match sites for miR-92a (see also Figure S4). The black rectangle represents the sha coding region and the black line the 3′ UTR. Numbering is with respect to the base-pair position on chromosome 2R. Red and yellow ovals represent predicted seed-match sites for miR-92a consensus sequences shown aligned with the mature miR-92a sequence. (B) Luciferase sensor assays in S2 cells show that the sha 3′ UTR confers >13-fold repression in response to ectopic miR-92a but is unaffected by control miR-1 and miR-184. Error bars show the SD from four independent transfections. (C) Representation of the T2 pupal leg showing the femur (Fe), tibia (Ti), tarsa (Ts), and claws (Cl). (D–G) Expression of pri-mir-92a (D and E) and sha (F and G), in the pupal T2 legs of strains e, wo, ro and Oregon-R at 24 hr APF. Arrowheads indicate the femur in each picture.

Comment in

References

    1. Li J., Zhang Z. miRNA regulatory variation in human evolution. Trends Genet. 2013;29:116–124. - PubMed
    1. Niwa R., Slack F.J. The evolution of animal microRNA function. Curr. Opin. Genet. Dev. 2007;17:145–150. - PubMed
    1. Ronshaugen M., Biemar F., Piel J., Levine M., Lai E.C. The Drosophila microRNA iab-4 causes a dominant homeotic transformation of halteres to wings. Genes Dev. 2005;19:2947–2952. - PMC - PubMed
    1. Alonso C.R., Wilkins A.S. The molecular elements that underlie developmental evolution. Nat. Rev. Genet. 2005;6:709–715. - PubMed
    1. Davis G.K., Srinivasan D.G., Wittkopp P.J., Stern D.L. The function and regulation of Ultrabithorax in the legs of Drosophila melanogaster. Dev. Biol. 2007;308:621–631. - PMC - PubMed

Publication types

MeSH terms