Clinical Trial
. 2013 Jul;62(7):2240-8.
doi: 10.2337/db12-1179. Epub 2013 Mar 1.

Mechanisms underlying the onset of oral lipid-induced skeletal muscle insulin resistance in humans

Affiliations
Clinical Trial

Mechanisms underlying the onset of oral lipid-induced skeletal muscle insulin resistance in humans

Bettina Nowotny et al. Diabetes. 2013 Jul.

Abstract

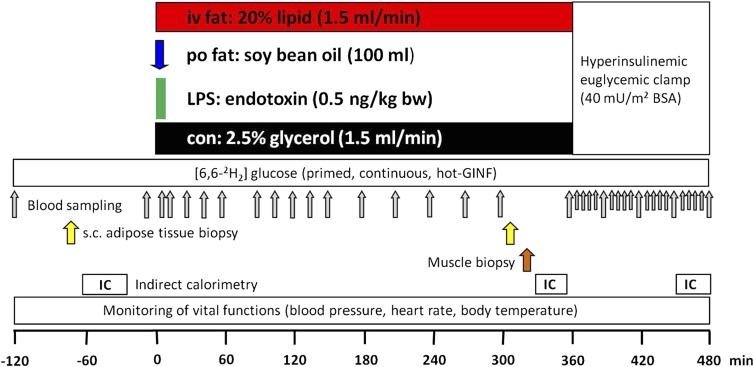
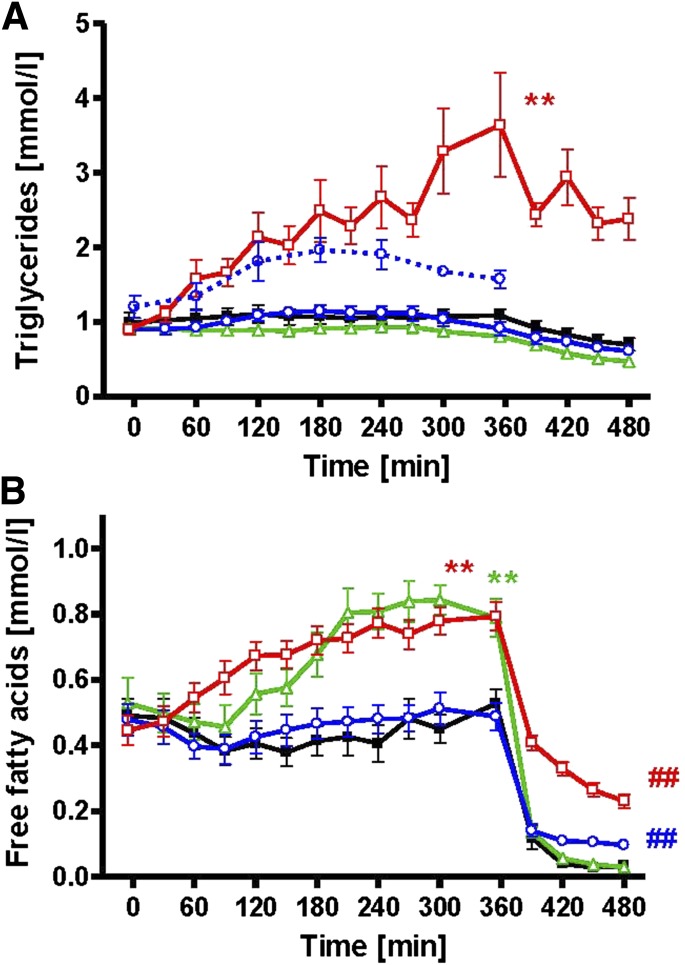
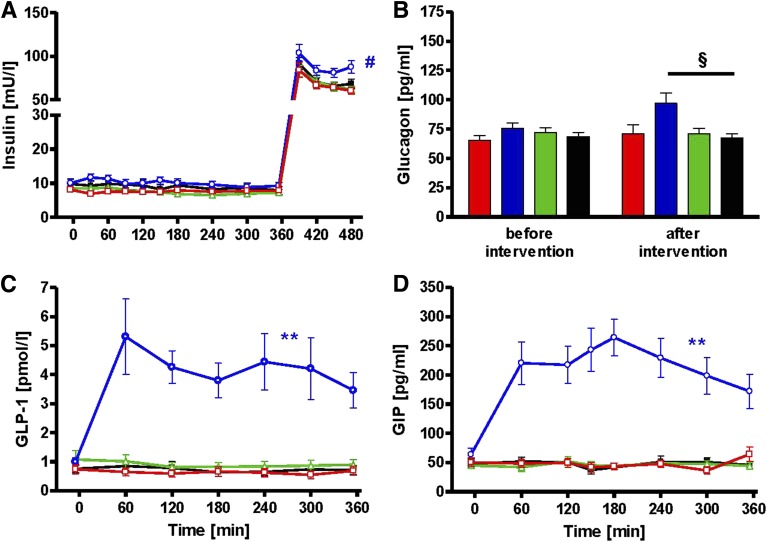
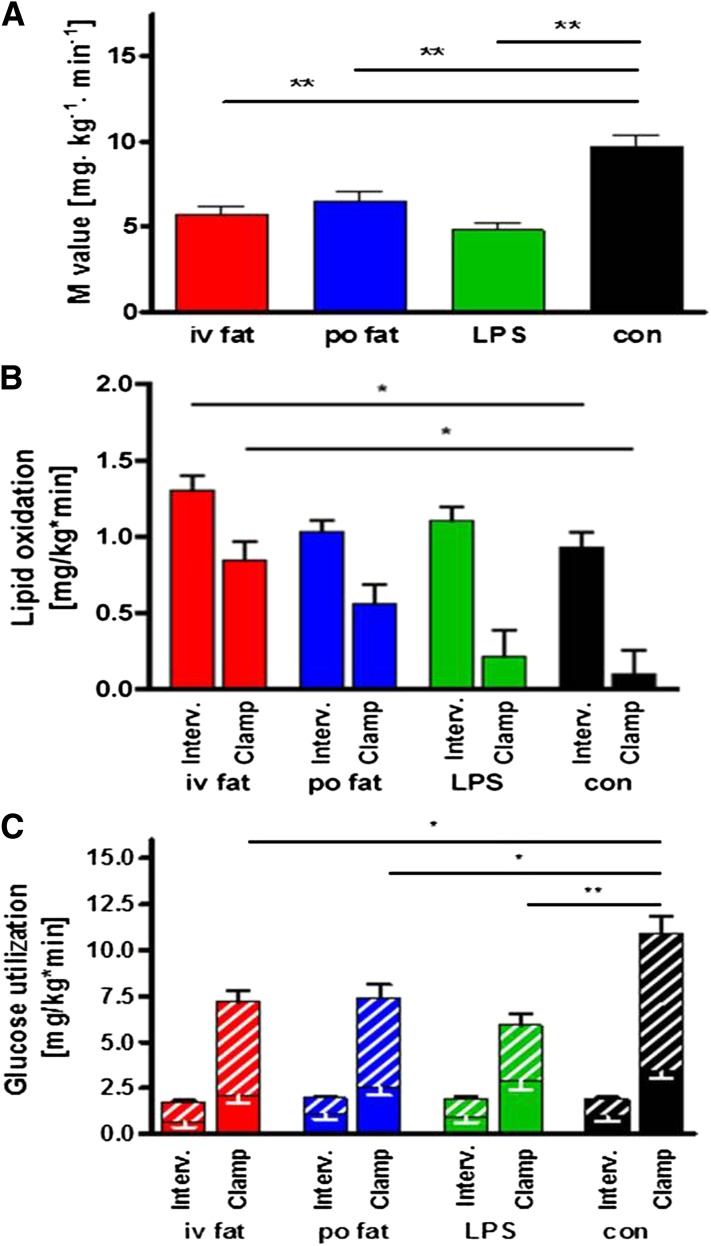
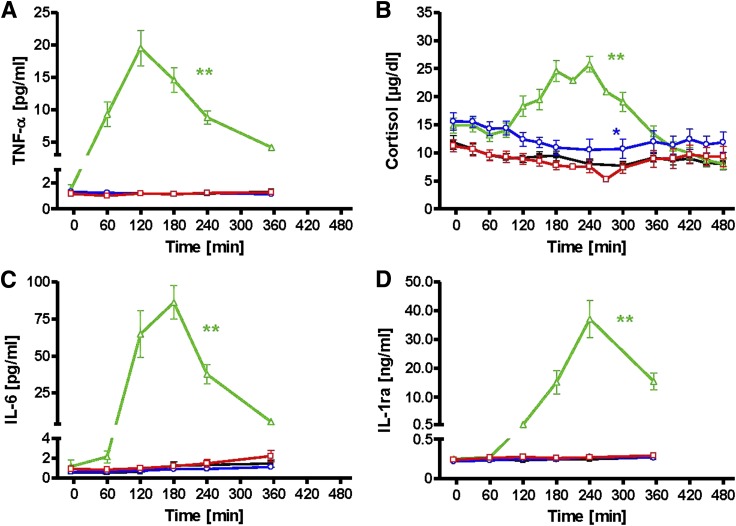
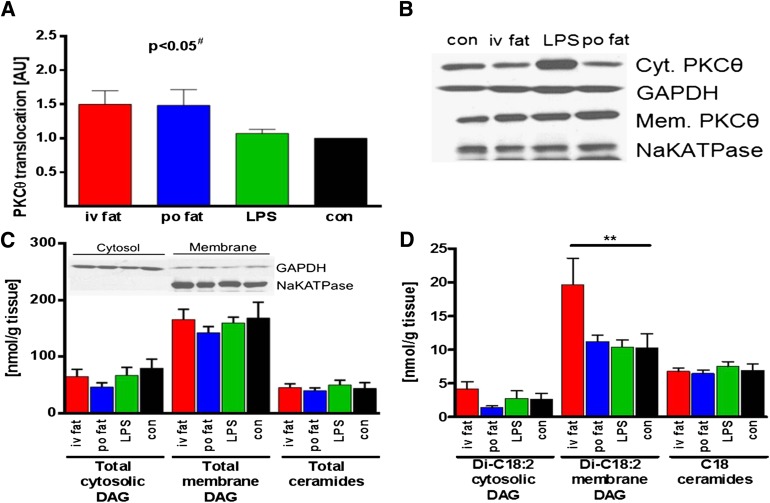
Several mechanisms, such as innate immune responses via Toll-like receptor-4, accumulation of diacylglycerols (DAG)/ceramides, and activation of protein kinase C (PKC), are considered to underlie skeletal muscle insulin resistance. In this study, we examined initial events occurring during the onset of insulin resistance upon oral high-fat loading compared with lipid and low-dose endotoxin infusion. Sixteen lean insulin-sensitive volunteers received intravenous fat (iv fat), oral fat (po fat), intravenous endotoxin (lipopolysaccharide [LPS]), and intravenous glycerol as control. After 6 h, whole-body insulin sensitivity was reduced by iv fat, po fat, and LPS to 60, 67, and 48%, respectively (all P < 0.01), which was due to decreased nonoxidative glucose utilization, while hepatic insulin sensitivity was unaffected. Muscle PKCθ activation increased by 50% after iv and po fat, membrane Di-C18:2 DAG species doubled after iv fat and correlated with PKCθ activation after po fat, whereas ceramides were unchanged. Only after LPS, circulating inflammatory markers (tumor necrosis factor-α, interleukin-6, and interleukin-1 receptor antagonist), their mRNA expression in subcutaneous adipose tissue, and circulating cortisol were elevated. Po fat ingestion rapidly induces insulin resistance by reducing nonoxidative glucose disposal, which associates with PKCθ activation and a rise in distinct myocellular membrane DAG, while endotoxin-induced insulin resistance is exclusively associated with stimulation of inflammatory pathways.

Trial registration: ClinicalTrials.gov NCT01054989.


Figures

FIG. 1.
FIG. 1.
Study protocol. One out of four interventions was started at 0 min at each study day: 1) iv fat: infusion of intralipid (1.5 mL/min) over 360 min; 2) po fat: 100 mL of soy bean oil consumed within 10 min; 3) LPS: short-term infusion of LPS (0.5 ng/kg body weight [bw]); or 4) control (con): infusion of 2.5% glycerol solution (1.5 mL/min) for 6 h. GINF, glucose infusion; s.c., subcutaneous; IC, indirect calorimetry.
FIG. 2.
FIG. 2.
Time course of total and chylomicron triglycerides (A) and FA (B) during iv fat (red), po fat (blue), LPS (green), control (black), and triglyceride content in chylomicron fraction after po fat as broken line (blue). **P < 0.01 for AUC during intervention vs. AUC during control; ##P < 0.01 vs. control at 480 min using repeated-measures ANOVA and post hoc Dunnett testing.
FIG. 3.
FIG. 3.
Time course of plasma insulin (A), glucagon (B), GLP-1 (C), and GIP (D) during iv fat (red), po fat (blue), LPS (green), and control (black). **P < 0.01 for AUC during po fat vs. AUC during control; #P < 0.05 po fat vs. control for mean of 450 and 480 min and P < 0.01 vs. fat iv and LPS, respectively; §P < 0.05 po fat vs. control using repeated-measures ANOVA and post hoc Dunnett testing.
FIG. 4.
FIG. 4.
Whole-body insulin sensitivity (A) and rates for lipid oxidation (B) and oxidative/nonoxidative glucose use (C). The M-value was obtained during steady-state conditions of the hyperinsulinemic-euglycemic clamp test. Lipid oxidation and glucose use were assessed after intervention (Interv.) and during steady-state conditions of hyperinsulinemic-euglycemic clamp (Clamp). iv fat (red), po fat (blue), LPS (green), and control (con; black), and hatched bars are given for nonoxidative glucose use. Mean ± SEMs are given. *P < 0.05, **P < 0.01 vs. control analyzed by repeated-measures ANOVA and post hoc Dunnett testing.
FIG. 5.
FIG. 5.
Time courses of systemic immune-regulating proteins and hormones. TNF-α (A), cortisol (B), IL-6 (C), and IL-1ra (D). iv fat (red), po fat (blue), LPS (green), and control (black). **P < 0.01 for AUC during intervention vs. AUC during control visit.
FIG. 6.
FIG. 6.
Muscle PKCθ translocation (A), total cytosolic (Cyt.) and membrane (Mem.) DAG, total ceramides (C), and C18 DAG and C18 ceramide levels (D). Representative blot of cytosolic/membrane PKCθ using enhanced chemiluminescence and respective control (con) proteins (sodium potassium ATPase [NaKATPase] for membrane and glyceraldehyde-3-phosphate dehydrogenase [GAPDH] for cytosolic band density) for correction (B), and enrichment of cytosolic/membrane markers after DAG fractionation is depicted as inset in C. Biopsies were taken 5 h after intervention: iv fat (red), po fat (blue), LPS (green), and control (con; black). #P < 0.05 for overall difference between groups analyzed by repeated-measures ANOVA; **P < 0.01 vs. control using repeated-measures ANOVA. AU, arbitrary units.

References

    1. Tabák AG, Jokela M, Akbaraly TN, Brunner EJ, Kivimäki M, Witte DR. Trajectories of glycaemia, insulin sensitivity, and insulin secretion before diagnosis of type 2 diabetes: an analysis from the Whitehall II study. Lancet 2009;373:2215–2221 - PMC - PubMed
    1. Gregor MF, Hotamisligil GS. Inflammatory mechanisms in obesity. Annu Rev Immunol 2011;29:415–445 - PubMed
    1. Samuel VT, Shulman GI. Mechanisms for insulin resistance: common threads and missing links. Cell 2012;148:852–871 - PMC - PubMed
    1. Jensen MD, Haymond MW, Rizza RA, Cryer PE, Miles JM. Influence of body fat distribution on free fatty acid metabolism in obesity. J Clin Invest 1989;83:1168–1173 - PMC - PubMed
    1. Paolisso G, Tataranni PA, Foley JE, Bogardus C, Howard BV, Ravussin E. A high concentration of fasting plasma non-esterified fatty acids is a risk factor for the development of NIDDM. Diabetologia 1995;38:1213–1217 - PubMed

Publication types

Associated data