. 2013 Apr;123(4):1694-704.
doi: 10.1172/JCI65569.

Formylpeptide receptor-2 contributes to colonic epithelial homeostasis, inflammation, and tumorigenesis

Affiliations

Formylpeptide receptor-2 contributes to colonic epithelial homeostasis, inflammation, and tumorigenesis

Keqiang Chen et al. J Clin Invest. 2013 Apr.

Abstract

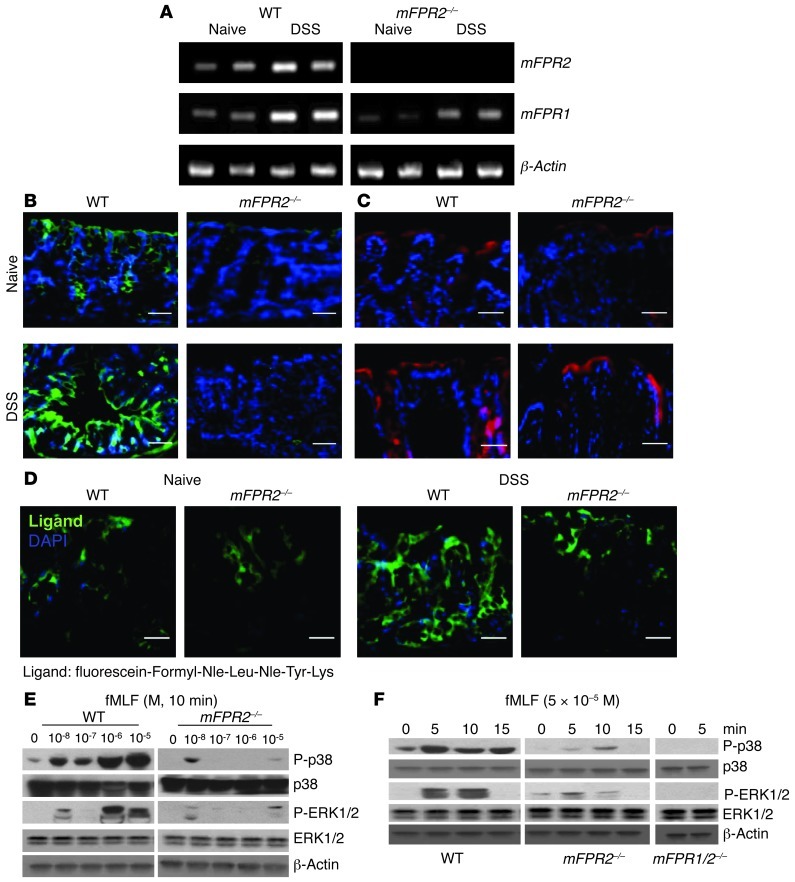
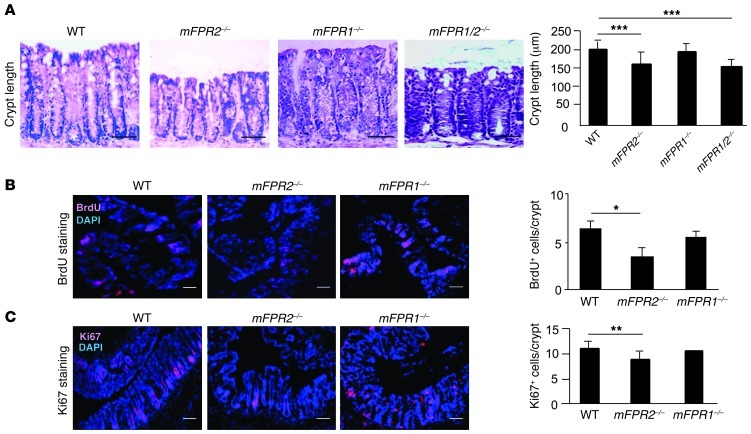
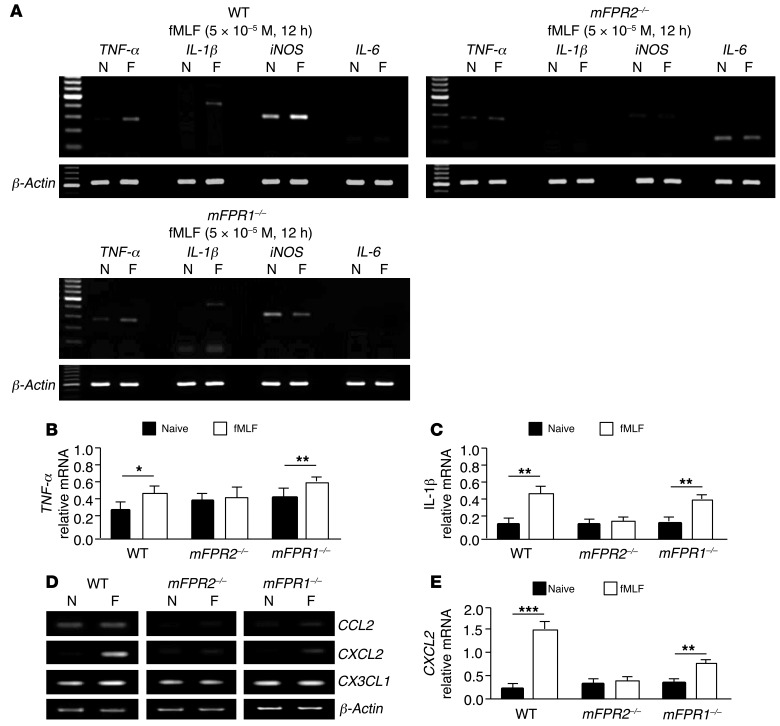
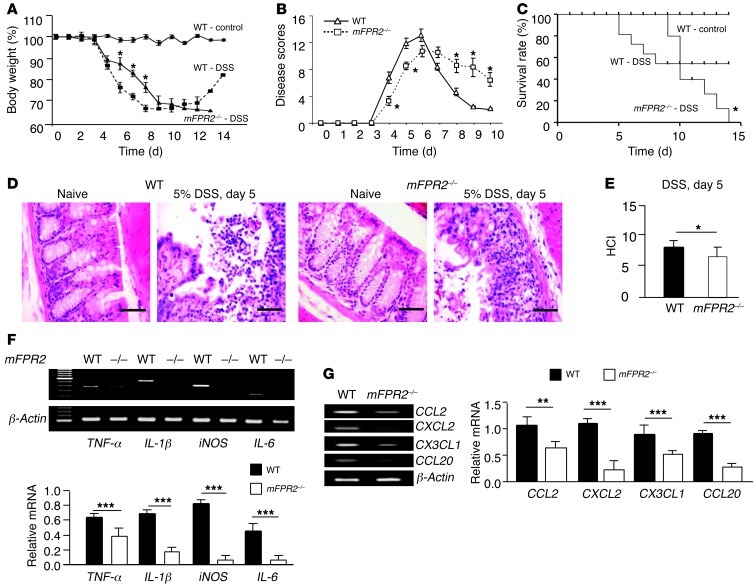
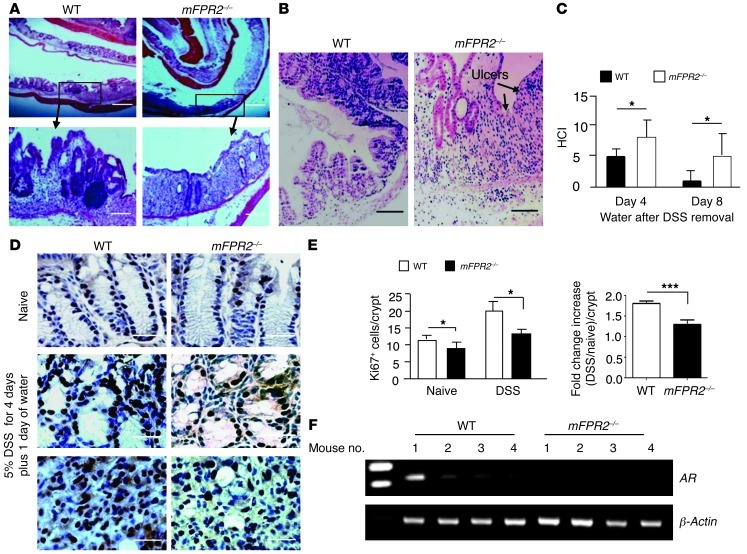
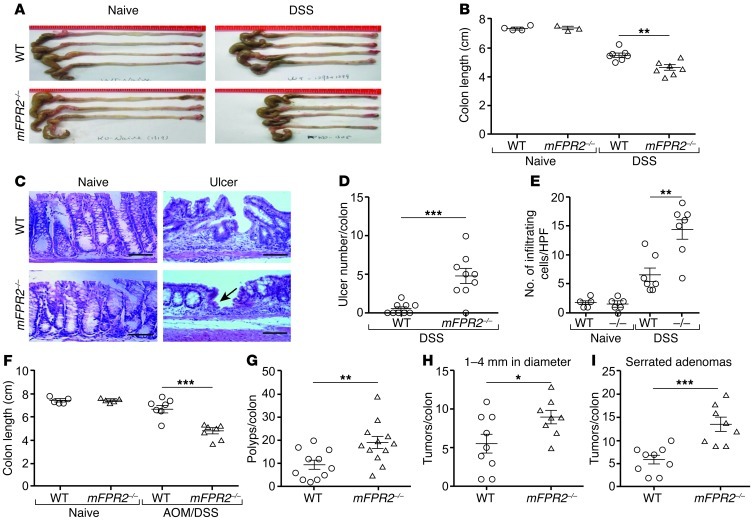
Commensal bacteria and their products provide beneficial effects to the mammalian gut by stimulating epithelial cell turnover and enhancing wound healing, without activating overt inflammation. We hypothesized that N-formylpeptide receptors, which bind bacterial N-formylpeptides and are expressed by intestinal epithelial cells, may contribute to these processes. Here we report that formylpeptide receptor-2 (FPR2), which we show is expressed on the apical and lateral membranes of colonic crypt epithelial cells, mediates N-formylpeptide-dependent epithelial cell proliferation and renewal. Colonic epithelial cells in FPR2-deficient mice displayed defects in commensal bacterium-dependent homeostasis as shown by the absence of responses to N-formylpeptide stimulation, shortened colonic crypts, reduced acute inflammatory responses to dextran sulfate sodium (DSS) challenge, delayed mucosal restoration after injury, and increased azoxymethane-induced tumorigenesis. These results indicate that FPR2 is critical in mediating homeostasis, inflammation, and epithelial repair processes in the colon.


Figures

Figure 1
Figure 1. The expression of mFPR2 in epithelial cells of mouse colon.
(A) mFPR2 and mFPR1 mRNA expression in colonic epithelial cells (composites). (B) mFPR2 protein expression in colonic epithelial cells. mFPR2 protein is in green fluorescence; nuclei are in blue (DAPI). Scale bars: 50 μm. (C) mFPR1 protein expression in colonic epithelial cells. mFPR1 is in red fluorescence; nuclei are in blue (DAPI). Scale bars: 50 μm. (D) Binding of fluorescein-Formyl-Nle-Leu-Nle-Tyr-Lys to colonic mucosa (green). Nuclei are in blue (DAPI). Scale bars: 100 μm. (E and F) fMLF-induced phosphorylation of MAPKs. A 4-cm colon segment was stimulated by infusion with fMLF for indicated concentrations or time points. The colonic mucosa was scraped and lysed, and p38 and ERK1/2 phosphorylation was measured by Western blotting. (E) Effect of different doses of fMLF at 10 minutes. (F) Effect of fMLF (5 × 10⁻⁵ M) at different time points. Data shown are representative of 3 independent experiments.
Figure 2
Figure 2. Proliferation of epithelial cells in mouse colon.
(A) Reduced length of colonic crypts in mFPR2–/– mice. H&E-stained sections of colons from naive WT, mFPR2–/–, mFPR1–/– and mFPR1/2–/– mice. Scale bars: 50 μm. Right panel: Cumulative measurement of colonic crypt length . (B) DNA synthesis in colonic epithelial cells. BrdU+ cells are in red; nuclei are in blue (DAPI). Scale bars: 100 μm. Right panel: Cumulative number of BrdU+ cells in the mouse colonic crypts. (C) Ki67 staining of colonic epithelial cells. Ki67+ cells are in red; nuclei are in blue (DAPI). Scale bars: 100 μm. Right panel: Cumulative number of Ki67+ cells in the colonic crypts. Results are expressed as the mean ± SEM; n = 5 mice per group. *P < 0.05; **P < 0.01; ***P < 0.001.
Figure 3
Figure 3. Expression of cytokine and chemokine mRNA in mouse colonic mucosa induced by fMLF.
(AE) Mice were administered fMLF (5 × 10⁻⁵ M) intrarectally. After 12 hours, the expression of mRNA for cytokines, iNOS, chemokines, and β-actin by mouse colonic epithelial cells was examined with RT-PCR (β-actin blot in A is a composite). Results are expressed as the mean ± SEM (B, C, and E); n = 5 mice per group. *P < 0.05; **P < 0.01; ***P < 0.001. Data shown are representative of 5 independent experiments.
Figure 4
Figure 4. DSS-induced mouse acute colitis.
Mice were given 5% DSS in drinking water for 5 days followed by normal water. (A) Body weight. * indicates significantly reduced body weight in WT mice compared with mFPR2–/– mice; n = 12 mice per group. P < 0.05. (B) Disease scores. * indicates a significant difference in mFPR2–/– mice compared with WT mice; n = 12 mice per group. P < 0.05. (C) Death rate of DSS-treated mice. * indicates significantly increased death rate shown by mFPR2–/– mice compared with WT mice after DSS intake; n = 9–18 mice per group. P < 0.001. (D) H&E-stained sections of colon treated with DSS for 5 days. Scale bars: 25 μm. (E) Histopathological change index (HCI). *P < 0.05. (F) Expression of cytokine mRNA in mouse colonic mucosa. Upper panel: Expression of cytokine, iNOS, and β-actin mRNA (blot is a composite). Lower panel: Cumulative results of relative mRNA levels of cytokines and iNOS (n = 5). Results are expressed as the mean ± SEM. ***P < 0.001. Experiments were repeated 3 times and results from representative experiments are shown. (G) Expression of chemokines in mouse colonic mucosa. Left panel: Chemokine mRNA expression. Right panel: Cumulative results of relative mRNA levels of chemokines. Results are expressed as the mean ± SEM; n = 5 mice per group. **P < 0.01; ***P < 0.001. Experiments were repeated 3 times and results from representative experiments are shown.
Figure 5
Figure 5. Impaired epithelial restitution in the colons of mFPR2–/– mice in DSS-induced acute colitis.
(A) H&E-stained sections of colon from mice treated with 5% DSS for 4 days followed by normal water for 4 days. Scale bars: 200 μm and 100 μm, respectively. (B) H&E-stained sections of colon from mice treated with 5% DSS for 4 days followed by normal water for 8 days. Arrows indicate ulcers. Scale bars: 100 μm. (C) HCI; n = 8 mice per group. *P < 0.05. (D) Ki67+-stained colonic crypts of mice treated with 5% DSS for 4 days followed by normal water for 1 day. Scale bars: 50 μm. Ki67+ cells are shown in brown. (E) Left panel: Cumulative number of Ki67+ cells in the colonic crypts from naive and DSS-treated mice. Right panel: Fold change increase of Ki67+ cells in the colonic crypts of DSS-treated mice versus naive mice. Results are expressed as the mean ± SEM; n = 5 mice per group. *P < 0.05; ***P < 0.001. (F) mRNA for AR in the colonic mucosa; n = 5 mice per group. Data shown are representative of 3 independent experiments.
Figure 6
Figure 6. DSS-induced chronic colonic inflammation and chronic colitis-associated tumorigenesis.
(AE) Mice were given 5% DSS in drinking water for 3 days followed by normal water for 15 days for 5 cycles. (A) Length of mouse colons. (B) Cumulative measurement of colon length. Results are expressed as the mean ± SEM; n = 7 mice per group. (C) Number of ulcers in the colons from WT or mFPR2–/– mice. Scale bars: 50 μm. (D) Cumulative number of ulcers in the colon. (E) Cumulative numbers of cells infiltrating the area surrounding the ulcers. Results are expressed as the mean ± SEM; n = 5–7 mice per group (D and E). Mean values were calculated from each mouse in different areas in the colon. *P < 0.05; **P < 0.01; ***P < 0.001 (B, D, and E). (FI) Increased tumorigenesis in the colons of mFPR2–/– mice with chronic colitis. Mice treated with AOM were given 2.5% DSS for 1 week followed by 2 weeks of regular drinking water. DSS and regular water treatment were repeated for 3 additional cycles. (F) Cumulative measurement of colon length after AOM and DSS treatment. (G) Cumulative number of tumors per colon (macroscopic view), and (H) cumulative numbers (mean ± SEM) of tumors per colon (1–4 mm in diameter) in WT and mFPR2–/– mice. (I) Number of serrated adenomas per colon; n = 8–9 mice per group (H and I). *P < 0.05; **P < 0.01; ***P < 0.001 (FI).

References

    1. Clevers H. At the crossroads of inflammation and cancer. Cell. 2001;118(6):671–674. doi: 10.1016/j.cell.2004.09.005. - DOI - PubMed
    1. Balkwill F, Mantovani A. Inflammation and cancer: back to Virchow? Lancet. 2001;357(9255):539–545. doi: 10.1016/S0140-6736(00)04046-0. - DOI - PubMed
    1. Coussens LM, Werb Z. Inflammation and cancer. Nature. 2002;420(6917):860–867. doi: 10.1038/nature01322. - DOI - PMC - PubMed
    1. Coussens LM, Tinkle CL, Hanahan D, Werb Z. MMP-9 supplied by bone marrow-derived cells contributes to skin carcinogenesis. Cell. 2000;103(3):481–490. doi: 10.1016/S0092-8674(00)00139-2. - DOI - PMC - PubMed
    1. Xiao H, et al. The Toll-interleukin-1 receptor member SIGIRR regulates colonic epithelial homeostasis, inflammation, and tumorigenesis. Immunity. 2007;26(4):461–475. doi: 10.1016/j.immuni.2007.02.012. - DOI - PubMed

Publication types

MeSH terms