. 2013 Apr;123(4):1542-55.
doi: 10.1172/JCI66517.

BM mesenchymal stromal cell-derived exosomes facilitate multiple myeloma progression

Affiliations

BM mesenchymal stromal cell-derived exosomes facilitate multiple myeloma progression

Aldo M Roccaro et al. J Clin Invest. 2013 Apr.

Erratum in

  • J Clin Invest. 2013 Aug 1;123(8):3635

Abstract

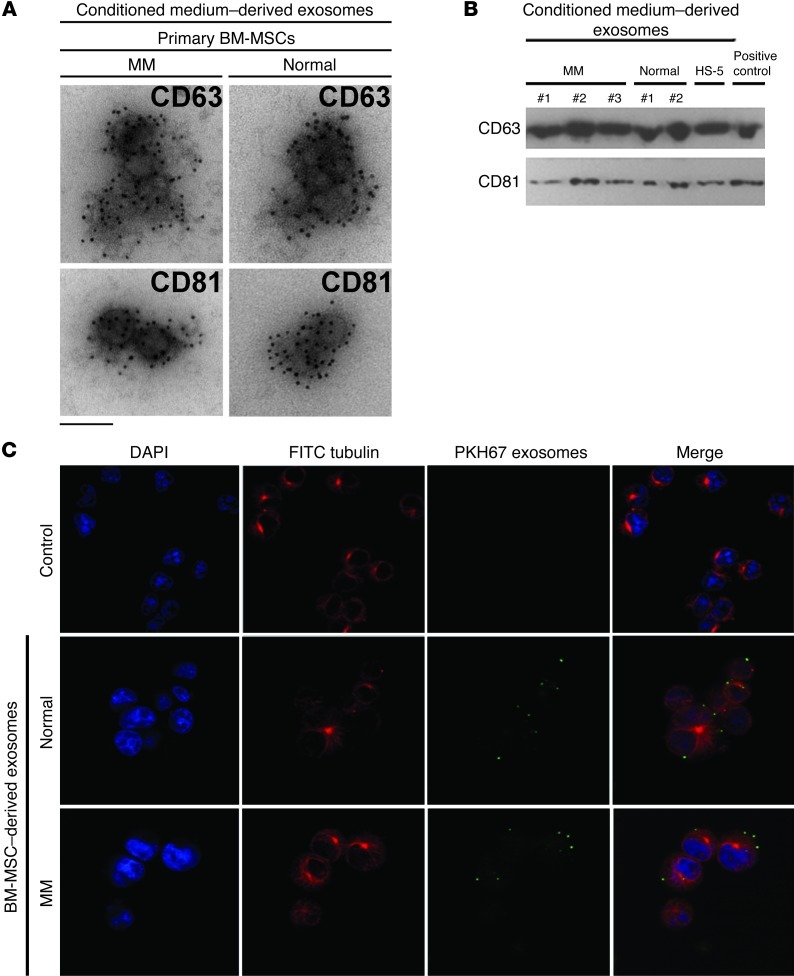
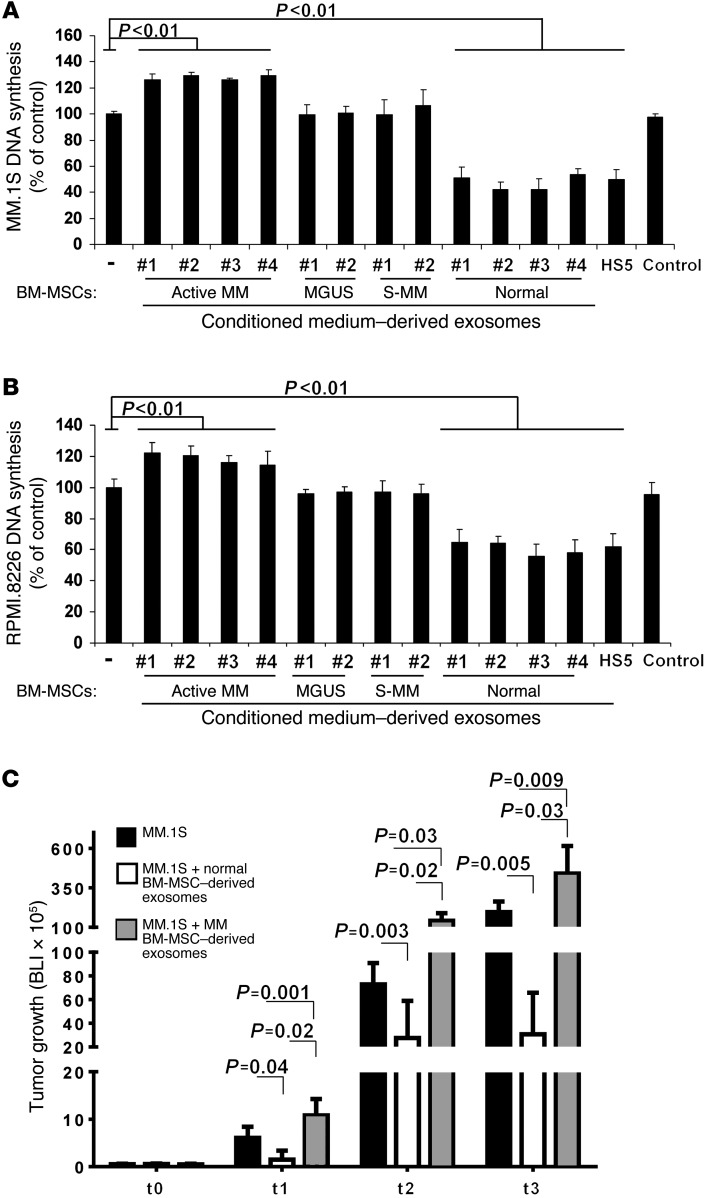
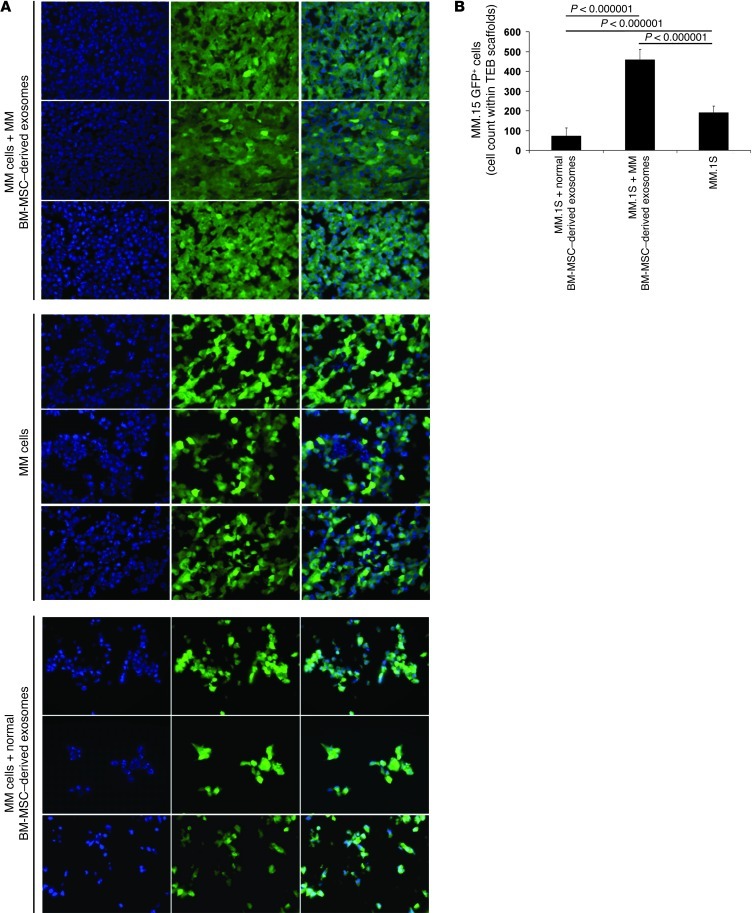
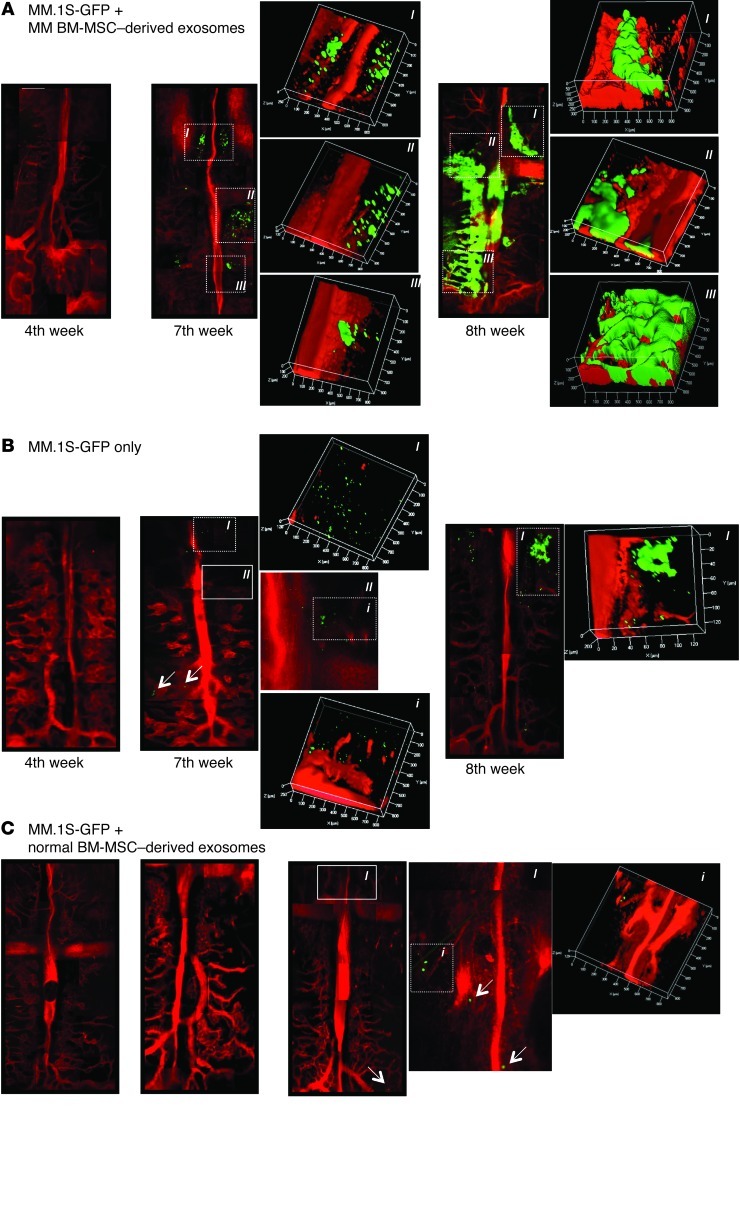
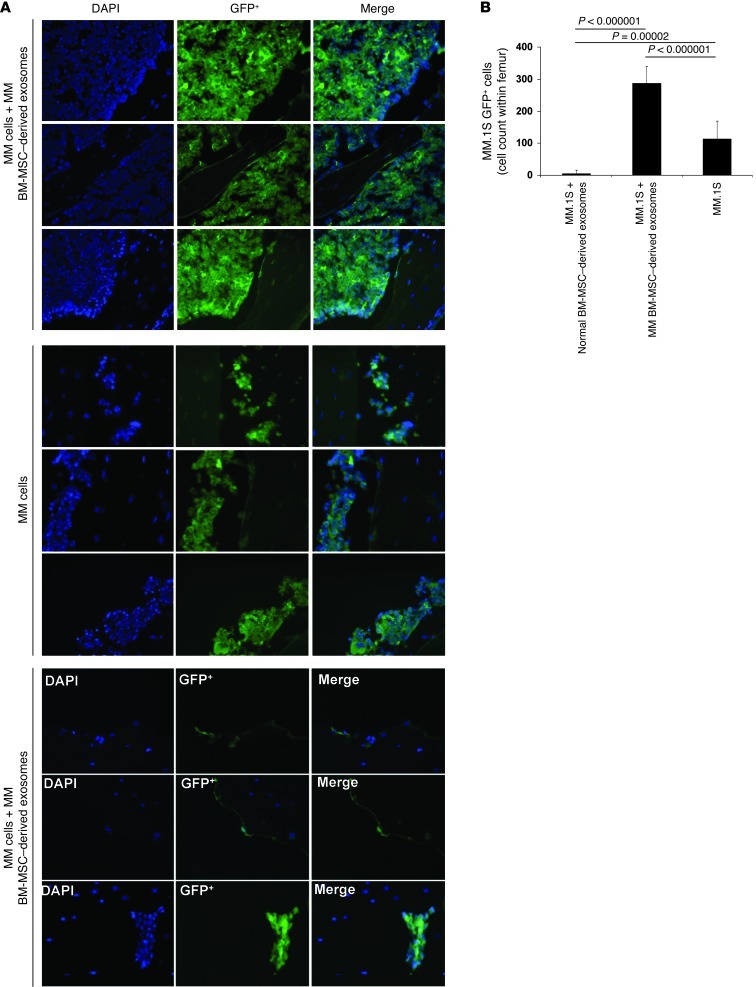
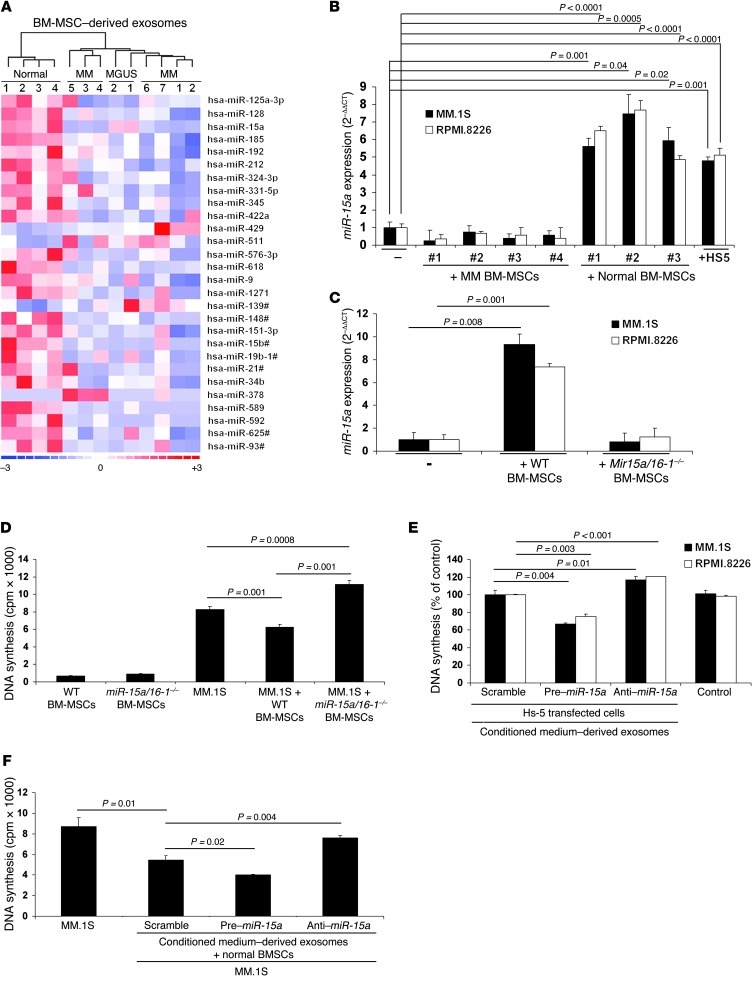
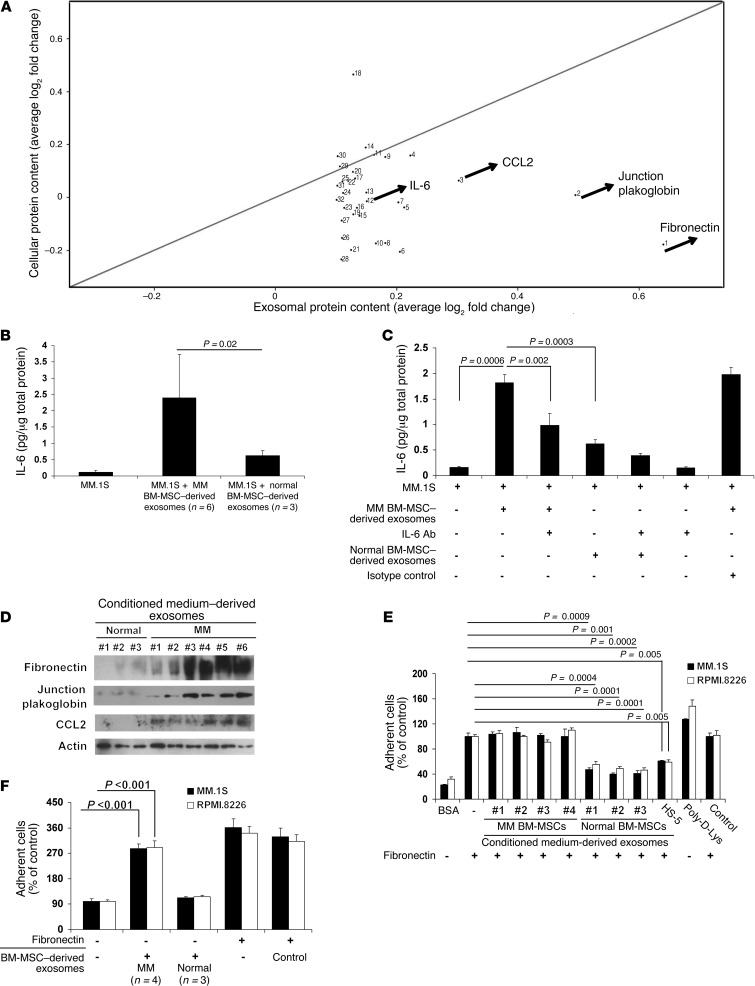
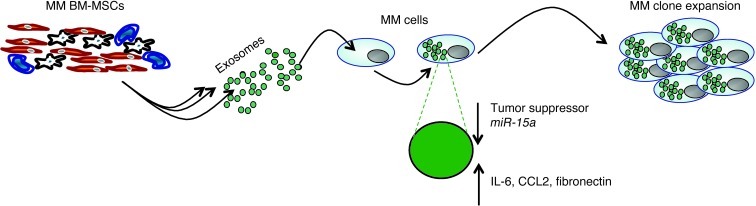
BM mesenchymal stromal cells (BM-MSCs) support multiple myeloma (MM) cell growth, but little is known about the putative mechanisms by which the BM microenvironment plays an oncogenic role in this disease. Cell-cell communication is mediated by exosomes. In this study, we showed that MM BM-MSCs release exosomes that are transferred to MM cells, thereby resulting in modulation of tumor growth in vivo. Exosomal microRNA (miR) content differed between MM and normal BM-MSCs, with a lower content of the tumor suppressor miR-15a. In addition, MM BM-MSC-derived exosomes had higher levels of oncogenic proteins, cytokines, and adhesion molecules compared with exosomes from the cells of origin. Importantly, whereas MM BM-MSC-derived exosomes promoted MM tumor growth, normal BM-MSC exosomes inhibited the growth of MM cells. In summary, these in vitro and in vivo studies demonstrated that exosome transfer from BM-MSCs to clonal plasma cells represents a previously undescribed and unique mechanism that highlights the contribution of BM-MSCs to MM disease progression.


Figures

Figure 1
Figure 1. Characterization of BM-MSC–derived exosomes and their ability to be transferred to MM cells.
(A) Primary BM-MSCs are able to release exosomes. Exosomes were immunogold labeled with anti-CD63 and anti-CD81. Scale bar: 100 nm. (B) Western blot on MM (n = 3) and normal (n = 2) BM-MSC–derived exosome proteins using anti-CD63 and anti-CD81 antibodies. The normal stromal cell line HS-5 is also shown. Lysates obtained from human CD63– or human CD81–transfected 293T cells served as positive controls. (C) MM.1S cells were cultured in the absence (control) or presence of normal or MM BM-MSC–derived PKH67-labeled exosomes for 30 minutes. Exosomes were uptaken from MM cells, as shown using a confocal microscope (original magnification, ×100). MM cells were stained using DAPI (nuclei) and FITC-conjugated anti-tubulin antibody.
Figure 2
Figure 2. Normal and MM BM-MSC–derived exosomes differentially affect MM cell proliferation in vitro and in vivo.
(A and B) MM cell lines MM.1S (A) and RPMI.8226 (B) (30,000 cells/well; RPMI medium plus 10% exosome-depleted FBS) were cultured in the absence or presence of MM (n = 4), MGUS (n = 2), smoldering MM (S-MM; n = 2), or normal (n = 4) BM-MSC–derived exosomes (200 μg/ml; 48 hours). Loaded exosomes are expressed as μg of protein-containing exosomes. Cell proliferation was assessed using [3H]-thymidine uptake. Cell-conditioned media absent cells and processed as in all samples tested served as control. Average of 3 independent experiments is shown. P values were generated using ANOVA. MM and normal BM-MSC–derived exosomes showed a differential impact on MM cell growth in vitro. (C) TEBs were loaded with GFP+Luc+ MM.1S cells alone or with primary MM or normal BM-MSC–derived exosomes (3 × 10⁶ cells/TEB; 1 μg exosomes) and implanted subcutaneously in SCID mice. Exosomes (1 μg) were also injected in situ every 4 days until the end of the studies. Tumor growth was determined by measuring bioluminescence imaging (BLI) intensity at baseline (t0) and days 7 (t1), 10 (t2), and 14 (t3) (n = 5 per group). MM and normal BM-MSC–derived exosomes showed a differential impact on MM cell growth in vivo.
Figure 3
Figure 3. Visualization and quantification of MM cells ex vivo on TEB scaffolds.
(A) Immunofluorescence detection of GFP+ MM.1S cells ex vivo on TEB scaffolds. Nuclei were stained using DAPI. 1 representative image per group is shown. Original magnification, ×40. (B) GFP+ MM.1S cells were counted in 4 different regions per TEB scaffold per mouse. Average ± SD count is shown.
Figure 4
Figure 4. Normal and MM BM-MSC–derived exosomes differentially affect MM cell homing and growth in vivo.
Detection of MM cell homing to the BM was performed by in vivo confocal microscopy (original magnification, ×5). Green, GFP+ MM cells (denoted by arrows); red, Evans Blue–positive blood vessels. Specific BM niches are shown in boxed regions with dotted lines; relative tridimensional reconstruction is shown for each panel (scale expressed in μm). In B, specific BM niches were obtained by changing the focal plane, moving toward the skull of the mouse (boxed region with solid line).
Figure 5
Figure 5. Visualization and quantification of MM cells ex vivo on femur BM.
(A) Immunofluorescence detection of GFP+ MM.1S cells ex vivo on bone tissues. Nuclei were stained using DAPI. 1 representative image per mouse per group is shown. Original magnification, ×40. (B) GFP+ MM.1S cells were counted in 4 different regions per femur per mouse. Average ± SD count is shown.
Figure 6
Figure 6. miR-15a expression differs between normal and MM BM-MSCs, and miR-15a–containing exosomes are transferred into MM cells.
(A) miR expression profiling on total RNA isolated from normal (n = 4), MM (n = 7), and MGUS (n = 2) BM-MSC–derived exosomes. A heatmap was generated after supervised hierarchical cluster analysis. Differential miR expression is shown by red (upregulation) versus blue (downregulation) intensity (d-Chip software; normal versus MM, 1.5-fold change, P < 0.05). (B) MM.1S and RPMI.8226 MM cells were cultured in the absence or presence of primary MM (n = 4) or normal (n = 3) BM-MSCs or the HS-5 cell line for 48 hours. miR-15a expression was determined by qRT-PCR in MM cells (2–ΔΔCt method, normalized to RNU6B miR as reference). Results are average ± SD of 3 independent experiments. miR-15a was upregulated in MM cells when in contact with normal BM-MSCs. (C) Murine exosomes were isolated from BM of WT or miR-15a/16-1–/– mice and subsequently added to MM cells for 48 hours. miR-15a levels were determined by qRT-PCR in human MM cells (2–ΔΔCt method, normalized to C. elegans miR-39 reference, used as spiked control). Bars represent SD. (D) MM cells were cultured in the presence or absence of murine WT or miR-15a/16-1–/– BM-MSCs for 48 hours, and cell proliferation was assessed as [3H]-thymidine uptake. Bars indicate SD. (E and F) HS-5 cells (E) or primary BM-MSCs (F) were transfected with scramble, pre–miR-15a, or anti–miR-15a probe. Cells were then exposed to the indicated exosomes for 48 hours. Cell-conditioned media absent cells and processed as in all samples tested served as control. Cell proliferation was assessed using [3H]-thymidine uptake assay. Bars indicate SD.
Figure 7
Figure 7. Characterization of exosomal protein content and functional sequelae.
(A) Scatter plot showing exosomal and cellular protein content of MM and normal BM-MSC–derived samples. (B) MM.1S cells were exposed to exosomes isolated from MM (n = 6) or normal (n = 3) BM-MSCs for 24 hours, and IL-6 concentration was measured on conditioned media using human IL-6 ELISA. Bars indicate SD. (C) MM.1S cells were exposed to exosomes isolated from MM or normal BM-MSCs for 24 hours, and IL-6 concentration was measured in conditioned media in the presence or absence of an IL-6–blocking antibody (0.2 μg/ml) using human IL-6 ELISA. Mouse IgG2B served as isotype control. Bars indicate SD. (D) Western blot on MM (n = 6) and normal (n = 3) BM-MSC–derived exosomes using anti-fibronectin, anti–junction plakoglobin, anti-CCL2, and anti-actin antibodies. (E and F) Adhesion of MM cells to BSA (negative control), poly-d-lysine (positive control), and fibronectin-coated wells, exposed or not to MM (n = 4) or normal (n = 3) BM-MSC–derived exosomes (200 μg/ml; 6 hours). Length of adhesion was 2 hours. All data are mean ± SD of triplicate experiments. Cell-conditioned media absent cells and processed as in all samples tested served as control.
Figure 8
Figure 8. BM-MSC–derived exosomes support MM clone expansion.

References

    1. Chauhan D, et al. Multiple myeloma cell adhesion-induced interleukin-6 expression in bone marrow stromal cells involves activation of NF-kappa B. Blood. 1996;87(3):1104–1112. - PubMed
    1. Gupta D, et al. Adherence of multiple myeloma cells to bone marrow stromal cells upregulates vascular endothelial growth factor secretion: therapeutic applications. Leukemia. 2001;15(12):1950–1961. doi: 10.1038/sj.leu.2402295. - DOI - PubMed
    1. Kumar S, et al. Bone marrow angiogenic ability and expression of angiogenic cytokines in myeloma: evidence favoring loss of marrow angiogenesis inhibitory activity with disease progression. Blood. 2004;104(4):1159–1165. doi: 10.1182/blood-2003-11-3811. - DOI - PubMed
    1. Pan BT, Johnstone RM. Fate of the transferrin receptor during maturation of sheep reticulocytes in vitro: selective externalization of the receptor. Cell. 1983;33(3):967–978. doi: 10.1016/0092-8674(83)90040-5. - DOI - PubMed
    1. Raposo G, et al. B lymphocytes secrete antigen-presenting vesicles. J Exp Med. 1996;183(3):1161–1172. doi: 10.1084/jem.183.3.1161. - DOI - PMC - PubMed

Publication types

MeSH terms

Associated data