. 2013 Mar;123(3):1032-43.
doi: 10.1172/JCI64742. Epub 2013 Feb 1.

Virus-induced hepatocellular carcinomas cause antigen-specific local tolerance

Affiliations

Virus-induced hepatocellular carcinomas cause antigen-specific local tolerance

Gerald Willimsky et al. J Clin Invest. 2013 Mar.

Abstract

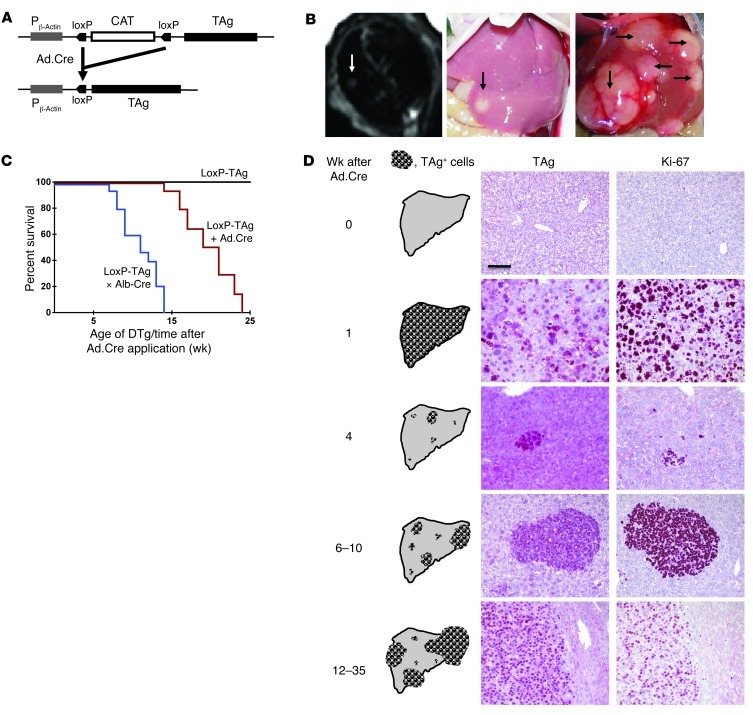
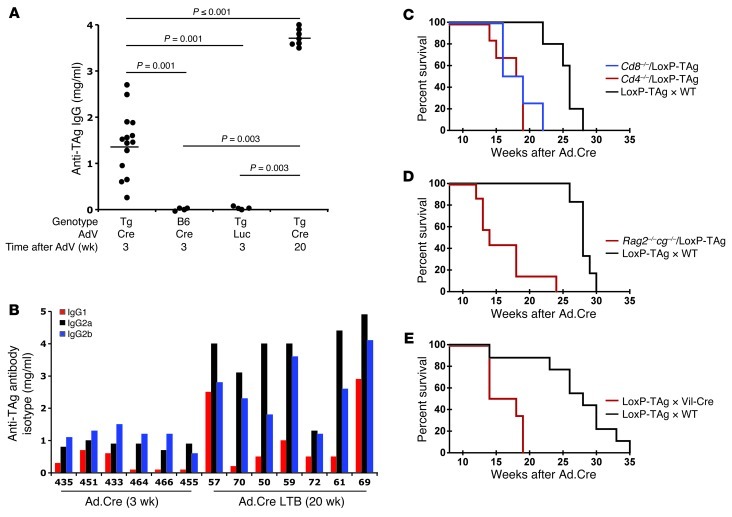
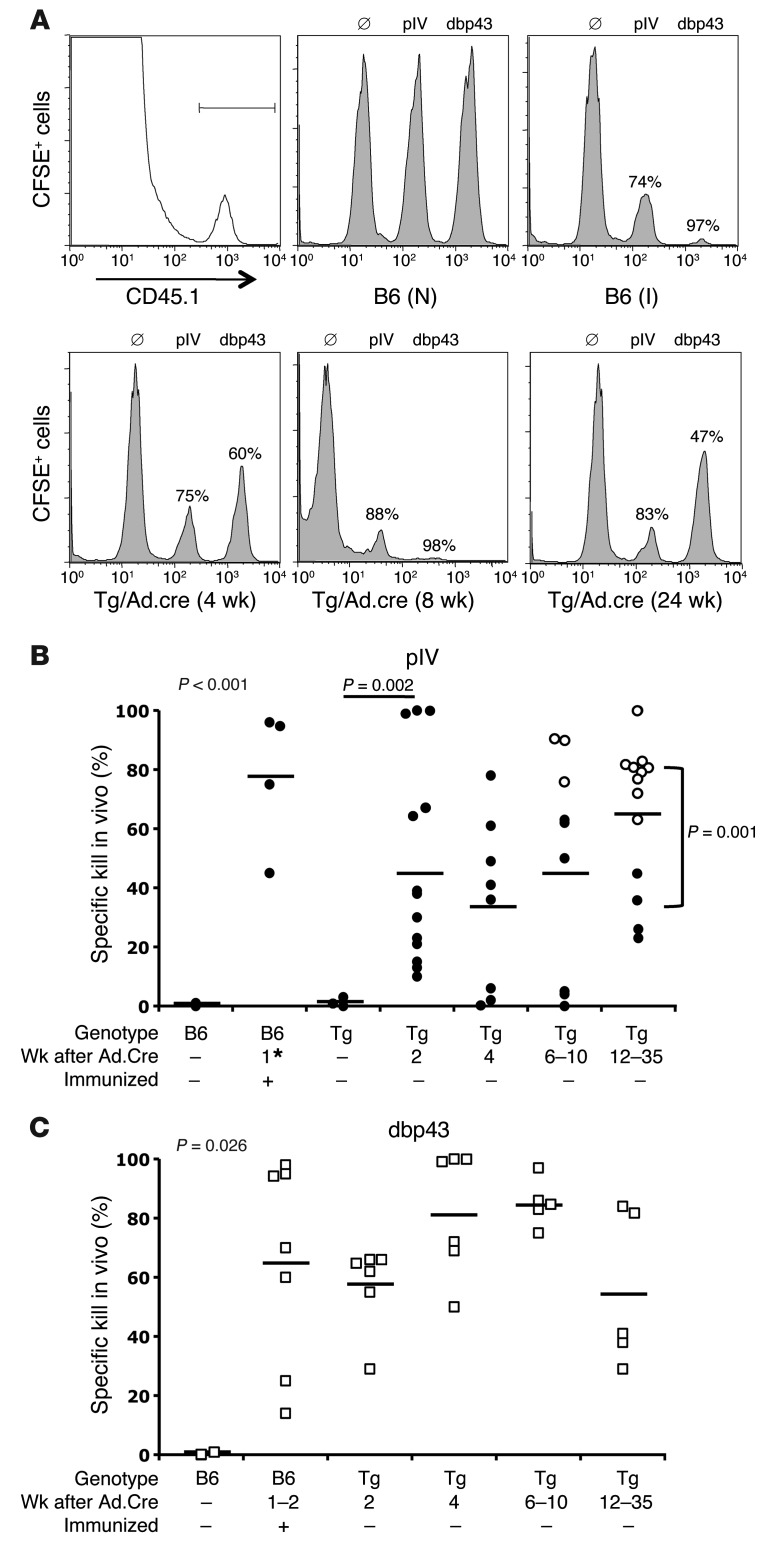
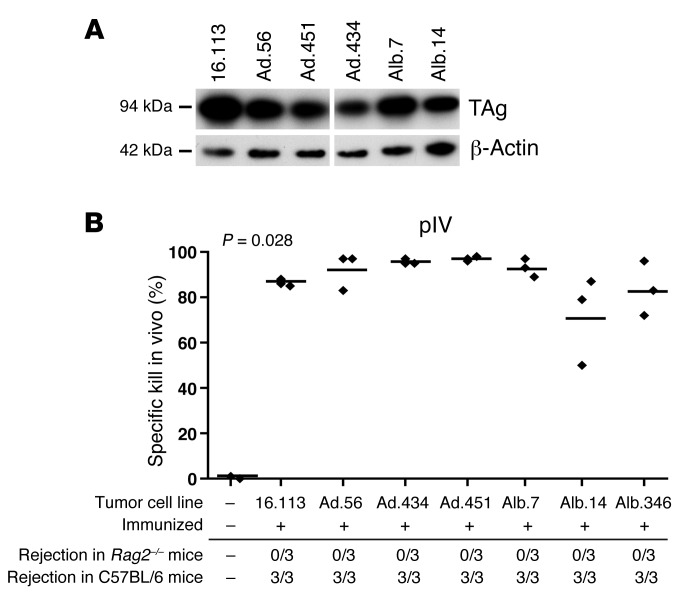
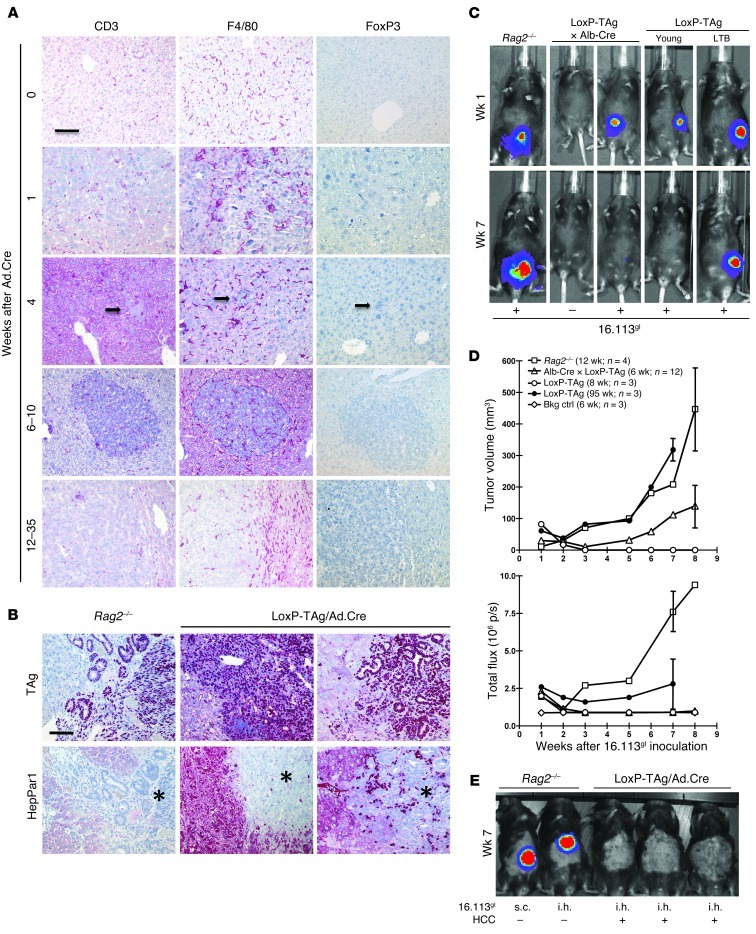
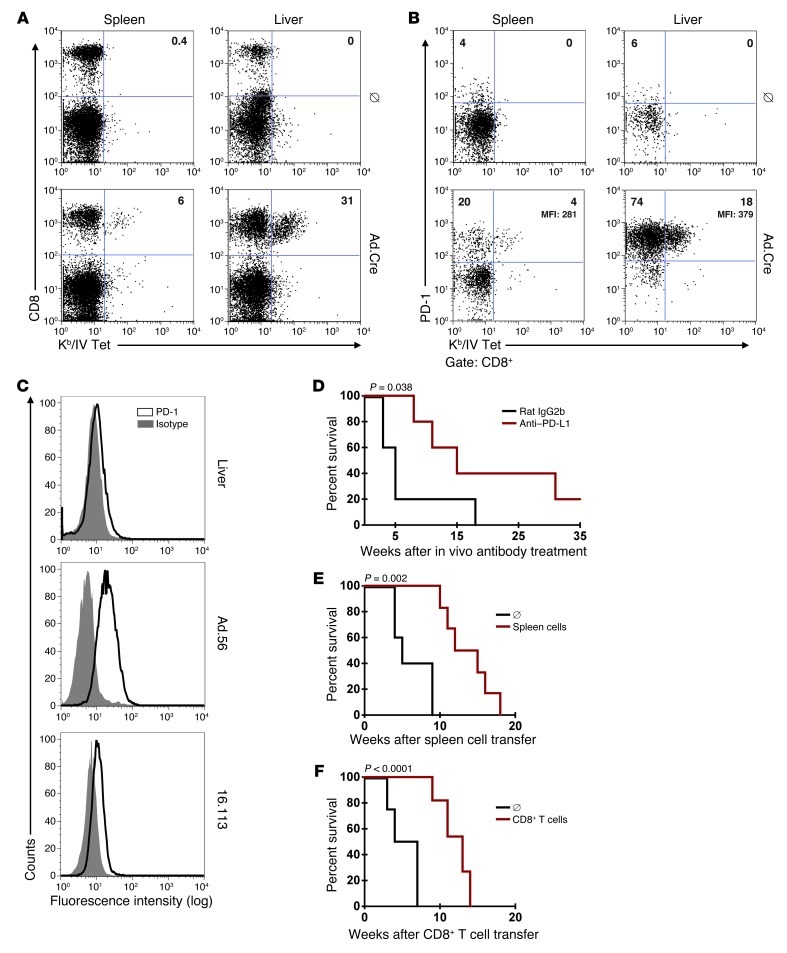
T cell surveillance is often effective against virus-associated tumors because of their high immunogenicity. It is not clear why surveillance occasionally fails, particularly against hepatitis B virus- or hepatitis C virus-associated hepatocellular carcinoma (HCC). We established a transgenic murine model of virus-induced HCC by hepatocyte-specific adenovirus-induced activation of the oncogenic SV40 large T antigen (TAg). Adenovirus infection induced cytotoxic T lymphocytes (CTLs) targeted against the virus and TAg, leading to clearance of the infected cells. Despite the presence of functional, antigen-specific T cells, a few virus-infected cells escaped immune clearance and progressed to HCC. These cells expressed TAg at levels similar to HCC isolated from neonatal TAg-tolerant mice, suggesting that CTL clearance does not select for cells with low immunogenicity. Virus-infected mice revealed significantly greater T cell infiltration in early-stage HCC compared with that in late-stage HCC, demonstrating progressive local immune suppression through inefficient T cell infiltration. Programmed cell death protein-1 (PD-1) and its ligand PD-L1 were expressed in all TAg-specific CD8+ T cells and HCC, respectively, which contributed to local tumor-antigen-specific tolerance. Thus, we have developed a model of virus-induced HCC that may allow for a better understanding of human HCC.


Figures

Figure 1
Figure 1. LoxP-TAg transgenic mice develop HCC after i.v. injection of Ad.Cre.
(A) Cre recombinase–mediated TAg activation. (B) For induction of HCC, 8- to 12-week-old LoxP-TAg mice were injected i.v. with 1 × 10⁹ PFUs of Ad.Cre, and HCC development was detected by MRI and palpation. Representative MR images (left) and macroscopically visible tumors of livers 10 (middle) and 20 weeks (right) after Ad.Cre injection are shown. MR image and liver photograph (middle) are from the same mouse. Arrows indicate tumor nodules. (C) LoxP-TAg mice that received Ad.Cre (red line, n = 14) and double-transgenic LoxP-TAg × Alb-Cre (DTg) mice (blue line, n = 15) were monitored for HCC development. Nontreated LoxP-TAg mice (black line; n = 10) served as control. Time after adenovirus injection is given for Ad.Cre-injected mice, and age is given for double-transgenic LoxP-TAg × Alb-Cre mice. (D) Immunohistology of liver tissue sections of LoxP-TAg mice at different time points after Ad.Cre injection as indicated. Tissues were stained with antibodies specific for TAg and Ki-67 and counterstained with hematoxylin. Scale bar: 100 μm. At least 3 mice were analyzed for each time point, and a representative staining is shown. Schematic drawings show an overview of the cumulative data of the average tumor number and progression not considering inter-mouse variability.
Figure 2
Figure 2. Immunity to the cancer-driving oncogene following virus-induced activation.
(A) The amount of TAg-specific IgG antibodies was determined in serum obtained from B6 (n = 4) and LoxP-TAg mice (Tg) 3 (n = 14) and 20 weeks (n = 7) after i.v. injection of Ad.Cre (1 × 10⁹ PFUs). Bars indicate mean values. As controls, LoxP-TAg mice were i.v. injected with 1 × 10⁹ PFUs of Ad.Luc (n = 4). LoxP-TAg mice analyzed 20 weeks after Ad.Cre injection had macroscopically visible tumors (see Figure 1, B and D). (B) LoxP-TAg mice develop TAg-specific antibodies of IgG1, IgG2a, and IgG2b isotypes upon Ad.Cre-mediated TAg activation. Amounts of TAg-specific IgG1, IgG2a, IgG2b, and IgG3 were determined in serum obtained from individual mice 3 and 20 weeks after Ad.Cre application. IgG3 was not detectable in any serum sample (not shown). Each number represents an individual mouse. LTB, large tumor bearing. (C) CD4+ T cell–deficient (Cd4–/– × LoxP-TAg; n = 6) and CD8+ T cell–deficient mice (Cd8–/– × LoxP-TAg; n = 4) received 1 × 10⁹ PFUs of Ad.Cre and were monitored for HCC development. Ad.Cre-treated T cell–competent LoxP-TAg mice (WT × LoxP-TAg; n = 5) served as controls. (D) Ad.Cre-treated Rag2–/–cg–/– × LoxP-TAg mice (n = 7) were monitored for HCC development. LoxP-TAg mice (n = 6) served as control. (E) TAg-tolerant Vil-Cre × LoxP-TAg mice (n = 6) were injected with 1 × 10⁹ PFUs of Ad.Cre and monitored for HCC development. LoxP-TAg mice (n = 9) served as controls. (CE) Time after adenovirus infection is given.
Figure 3
Figure 3. Ad.Cre-mediated TAg activation in LoxP-TAg mice induces functional pIV-specific CTLs, which increase with tumor burden.
CTL activity against pIV alone or simultaneously against pIV and adenovirus dbp43 was analyzed in vivo. For simultaneous detection of CTL activity against pIV and dbp43, nonloaded and pIV- and dbp43-loaded CD45.1 congenic spleen cells (1 × 10⁷ each) were labeled with different amounts of CFSE and injected into the indicated mice, and 18 hours later the ratio between different populations was determined by flow cytometry, gated on CD45.1+ cells. The percentage of specific killing is indicated. In some experiments, only pIV-specific CTLs were analyzed. (A) Gating for the injected CD45.1+ spleen cells and one representative example per experimental group is shown for the simultaneous detection of pIV and dbp43 CTLs. Naive 8- to 12-week-old B6 (N), immunized 8- to 12-week-old B6 (I), and 8- to 12-week-old LoxP-TAg (Tg) mice 2, 4, 6–10, and 12–35 weeks after Ad.Cre injection were analyzed. Immunization of B6 mice was performed either by single i.p. injection of 0.5 × 10⁷ to 1 × 10⁷ 16.113 cells or simultaneous injection of 16.113 cells (i.p.) and 1 × 10⁹ PFUs Ad.Cre (i.v.). (B) The combined data of pIV-specific kill are shown. White circles represent LoxP-TAg mice with liver tumors larger than 5 mm in diameter. Black circles represent B6 and LoxP-TAg mice with no tumors or LoxP-TAg mice with liver tumors smaller than 5 mm in diameter. Each symbol represents 1 mouse; horizontal bars indicate mean values. Some of the B6 mice were injected with 16.113 only (asterisk). The P value at the top left of the graph represents overall significance calculated by Krusal-Wallis test. (C) The combined data of dbp43-specific kill are shown. Each symbol represents 1 mouse; horizontal bars indicate mean values. The P value at the top left of the graph represents overall significance calculated by Krusal-Wallis test.
Figure 4
Figure 4. Transplanted Ad.Cre-induced HCCs from LoxP-TAg mice are as immunogenic as those from TAg-tolerant LoxP-TAg × Alb-Cre mice.
(A) Similar TAg expression in HCC lines derived from Ad.Cre-treated LoxP-TAg mice and LoxP-TAg × Alb-Cre mice. Western blot analysis of TAg expression in primary HCC lines derived from Ad.Cre-treated LoxP-TAg mice (Ad.56, Ad.451, Ad.434) and LoxP-TAg × Alb-Cre mice (Alb.7, Alb.14). Sporadic TAg+ tumor line 16.113 was used as a control. 20 μg protein was separated by SDS-PAGE gel, blotted onto nitrocellulose membrane, and incubated with anti-TAg antibodies. After autoradiography, the membrane was stripped and reprobed with anti–β-actin antibodies as loading control. The lanes were run on the same gel but were noncontiguous. (B) TAg+ HCC lines induced pIV-specific CTLs. 1 × 10⁶ cells of tumor lines 16.113 and HCC lines as indicated were injected s.c. into B6 mice, and 10 days later pIV-specific in vivo kill was assays were performed as in Figure 3. The percentage of specific killing of peptide-loaded cells is indicated. Each symbol represents 1 mouse; bars indicate mean values. The P value represents overall significance of the graph calculated by Krusal-Wallis test. In a separate experiment, 1 × 10⁶ TAg+ HCC cells and, as a control tumor line, 16.113 cells, were injected s.c. into untreated 8- to 12-week-old Rag-2–deficient and immunocompetent B6 mice. Tumor growth was followed using calliper measurement. Shown is the number of mice that rejected challenge tumor per mice in experiment. Mice were observed until challenge tumors grew up to an average size of at least 10 mm in diameter. Mice that rejected the transplanted tumor cells were observed for at least 90 days.
Figure 5
Figure 5. Ad.Cre-induced HCCs in LoxP-TAg mice cause antigen-specific local tolerance.
(A) HCC tissues were stained for CD3, F4/80, and FoxP3 expression. Arrows indicate a small TAg+ lesion (also depicted in Figure 1D). One representative out of three experiments per time point is shown. (B) 1 × 10⁶ TAg+ 16.113gl cells were injected i.h. into Rag2–/– and HCC-bearing LoxP-TAg mice, and 7–12 weeks later liver tissues were stained for TAg and HepPar1. HepPar1-negative areas indicate 16.113 tumors (asterisks). Note that tumors grew in both groups of mice. Scale bar: 100 μm (A and B). (C) Selection of antigen-loss variants of 16.113gl cells in LoxP-TAg × Alb-Cre but not Rag2–/– mice. LoxP-TAg × Alb-Cre (6 weeks), young LoxP-TAg (8 weeks), large tumor-bearing LoxP-TAg (95 weeks), and Rag2–/– mice (8–12 weeks) injected s.c. with 1 × 10⁷ 16113gl cells were analyzed by BL imaging and tumor growth. Nontreated mice injected with luciferin served as controls (–; bkg ctrl). Images are representative for 2 experiments. (D) Tumor growth and Fluc signals of mice shown in C. Data shown are combined from 2 experiments; error bars represent SEM. Age and number of mice are shown in parenthesis. (E) Loss of BL signal of i.h. injected 16.113gl cells in HCC-bearing LoxP-TAg mice, but not in Rag2–/– mice, 2–6 months after Ad.Cre infection, as detected by BL imaging. Representative Rag2–/– (s.c., n = 2; i.h., n = 4) and HCC-bearing mice (i.h., n = 14) 7 weeks after 16.113gl cell injection are shown. See also Supplemental Figure 8.
Figure 6
Figure 6. Local tolerance is mediated by PD-1/PD-L1–dependent and –independent mechanisms.
(A) Spleen and liver cells from nontreated and HCC-bearing LoxP-TAg mice 27 weeks after Ad.Cre infection were analyzed for CD8 expression and Kb/IV tetramer binding. Representative plots (n = 3; range from 14%–31% double-positive cells) are shown. (B) CD8+ T cells as in A were analyzed for PD-1 expression and Kb/IV tetramer binding. Representative plots (n = 4; 7%–23% of Kb/IV tetramer+ CD8+ T cells expressed PD-1) are shown. (C) Hepatocytes from nontreated LoxP-TAg mice (liver), HCC line Ad.56, and 16.113 cells were stained with isotype control or anti–PD-L1 antibodies. Representative plots (n = 4) are shown. (D) HCC-bearing LoxP-TAg mice 12 weeks after Ad.Cre infection received anti–PD-L1 (red line, n = 5) or isotype control antibody (black line, n = 5) for 2 weeks, and survival was monitored. One of two experiments with comparable results is shown. (E) HCC-bearing LoxP-TAg mice 14 weeks after Ad.Cre injection (red line, n = 6) received irradiation (5 Gy) and 5 × 10⁶ spleen cells from Ad.Cre-treated HCC-bearing LoxP-TAg mice (18 weeks after Ad.Cre injection) or were left untreated (black line, n = 5), and survival was monitored (see also Supplemental Figure 14B). (F) Irradiated HCC-bearing LoxP-TAg mice 16 weeks after Ad.Cre injection (red line, n = 11) were treated with 1 × 10⁶ CD8+ T cells obtained from mice as in E or left untreated (black line, n = 4), and survival was monitored.

References

    1. Blankenstein T. Do autochthonous tumors interfere with effector T cell responses? Semin Cancer Biol. 2007;17(4):267–274. doi: 10.1016/j.semcancer.2007.06.007. - DOI - PubMed
    1. Klein G, Klein E. Rejectability of virus-induced tumors and nonrejectability of spontaneous tumors: a lesson in contrasts. Transplant Proc. 1977;9(1):1095–1104. - PubMed
    1. Bowen DG, Zen M, Holz L, Davis T, McCaughan GW, Bertolino P. The site of primary T cell activation is a determinant of the balance between intrahepatic tolerance and immunity. J Clin Invest. 2004;114(5):701–712. - PMC - PubMed
    1. Gruener NH, et al. Sustained dysfunction of antiviral CD8+ T lymphocytes after infection with hepatitis C virus. J Virol. 2001;75(12):5550–5558. doi: 10.1128/JVI.75.12.5550-5558.2001. - DOI - PMC - PubMed
    1. Lukens JR, Dolina JS, Kim TS, Tacke RS, Hahn YS. Liver is able to activate naive CD8+ T cells with dysfunctional anti-viral activity in the murine system. PLoS One. 2009;4(10):e7619. doi: 10.1371/journal.pone.0007619. - DOI - PMC - PubMed

Publication types

MeSH terms