

A community-driven global reconstruction of human metabolism
- PMID: 23455439
- PMCID: PMC3856361
- DOI: 10.1038/nbt.2488
A community-driven global reconstruction of human metabolism
Abstract
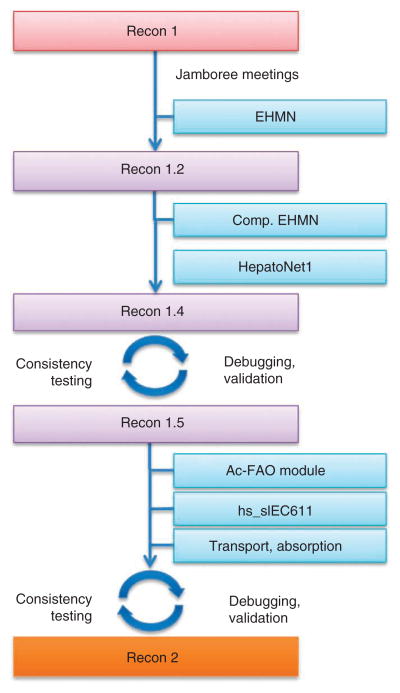
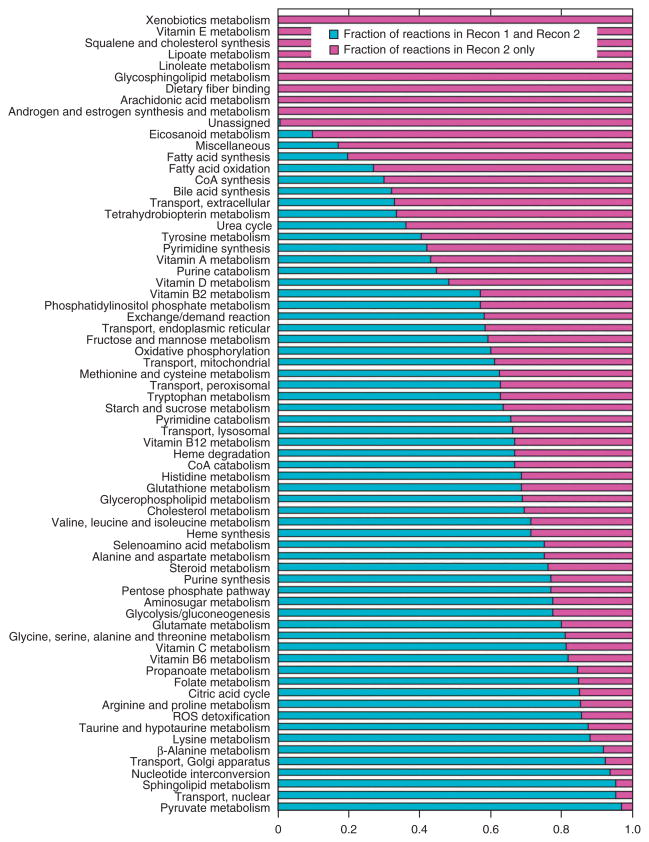
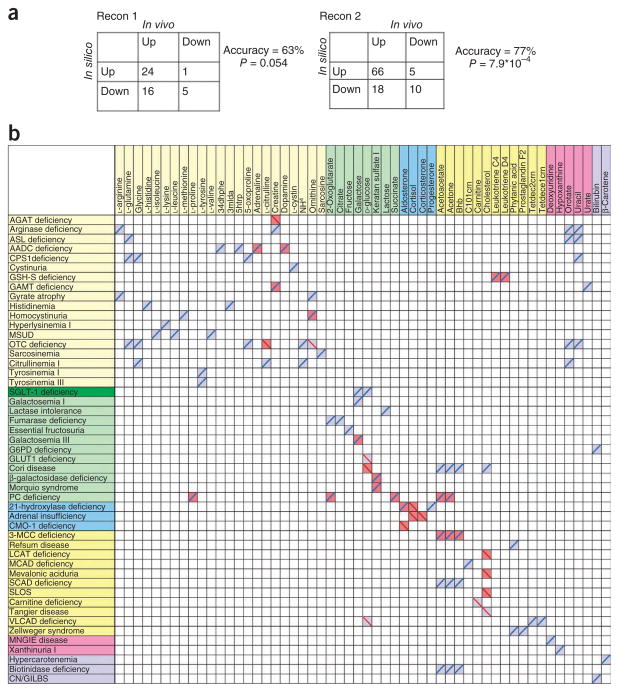
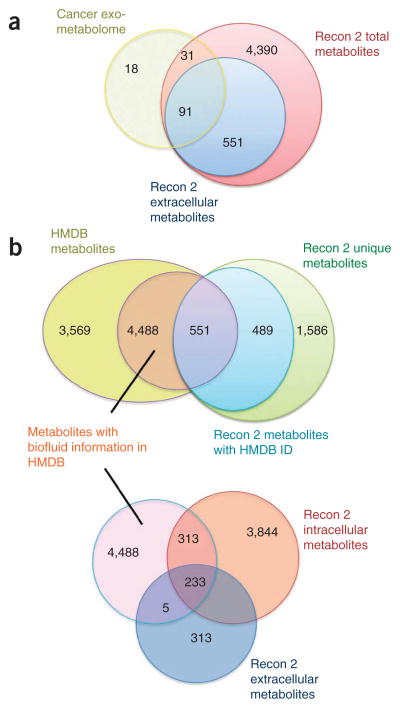
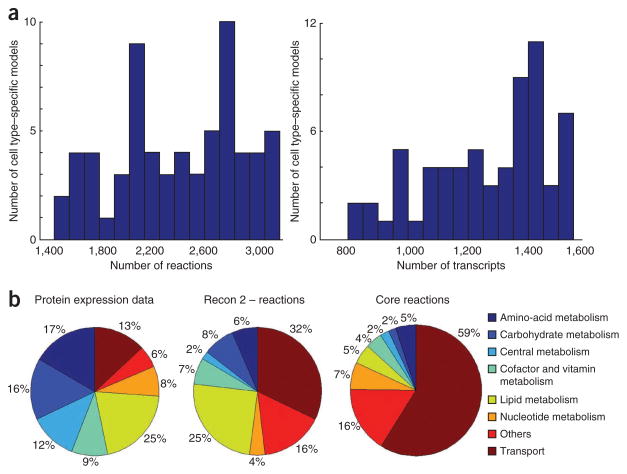
Multiple models of human metabolism have been reconstructed, but each represents only a subset of our knowledge. Here we describe Recon 2, a community-driven, consensus 'metabolic reconstruction', which is the most comprehensive representation of human metabolism that is applicable to computational modeling. Compared with its predecessors, the reconstruction has improved topological and functional features, including ∼2× more reactions and ∼1.7× more unique metabolites. Using Recon 2 we predicted changes in metabolite biomarkers for 49 inborn errors of metabolism with 77% accuracy when compared to experimental data. Mapping metabolomic data and drug information onto Recon 2 demonstrates its potential for integrating and analyzing diverse data types. Using protein expression data, we automatically generated a compendium of 65 cell type-specific models, providing a basis for manual curation or investigation of cell-specific metabolic properties. Recon 2 will facilitate many future biomedical studies and is freely available at http://humanmetabolism.org/.
Conflict of interest statement
The authors declare no competing financial interests.
Figures
References
-
- Palsson B. Systems biology: properties of reconstructed networks. Cambridge University Press; 2006.
Publication types
MeSH terms
Substances
Grants and funding
- R01 GM070923/GM/NIGMS NIH HHS/United States
- BB/F00561X/BB_/Biotechnology and Biological Sciences Research Council/United Kingdom
- R01 GM088244/GM/NIGMS NIH HHS/United States
- BBS/E/B/000C0419/BB_/Biotechnology and Biological Sciences Research Council/United Kingdom
- R01GM080219/GM/NIGMS NIH HHS/United States
- R01 GM080219/GM/NIGMS NIH HHS/United States
- R01GM070923/GM/NIGMS NIH HHS/United States
- BB/F005938/BB_/Biotechnology and Biological Sciences Research Council/United Kingdom
- U01 GM102098/GM/NIGMS NIH HHS/United States
- BB/C008219/1/BB_/Biotechnology and Biological Sciences Research Council/United Kingdom
- GM088244/GM/NIGMS NIH HHS/United States
- BB/E006248/1/BB_/Biotechnology and Biological Sciences Research Council/United Kingdom
LinkOut - more resources
Full Text Sources
Other Literature Sources
Molecular Biology Databases
