. 2013 May;9(5):300-6.
doi: 10.1038/nchembio.1204. Epub 2013 Mar 3.

NNMT promotes epigenetic remodeling in cancer by creating a metabolic methylation sink

Affiliations

NNMT promotes epigenetic remodeling in cancer by creating a metabolic methylation sink

Olesya A Ulanovskaya et al. Nat Chem Biol. 2013 May.

Abstract

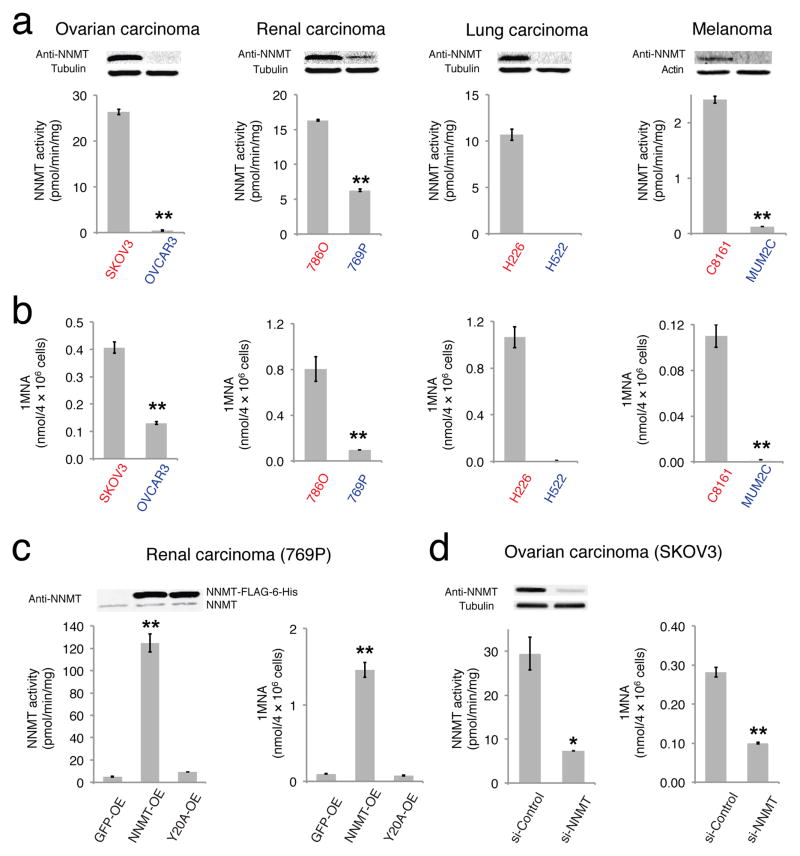
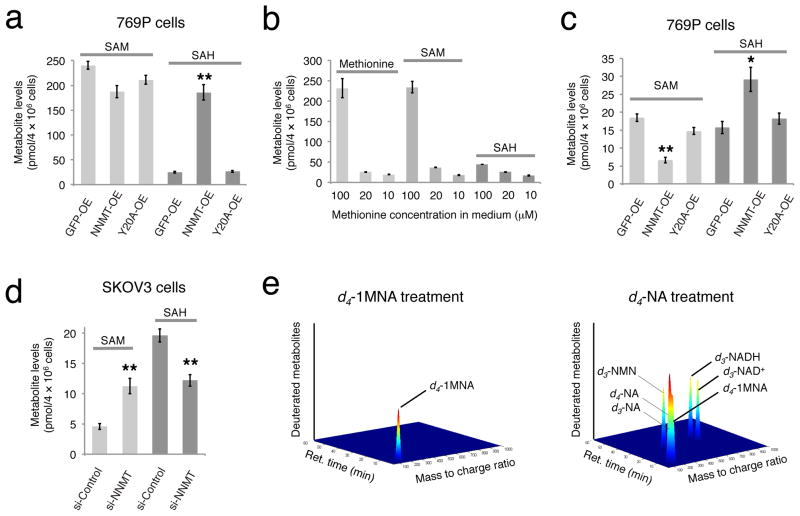
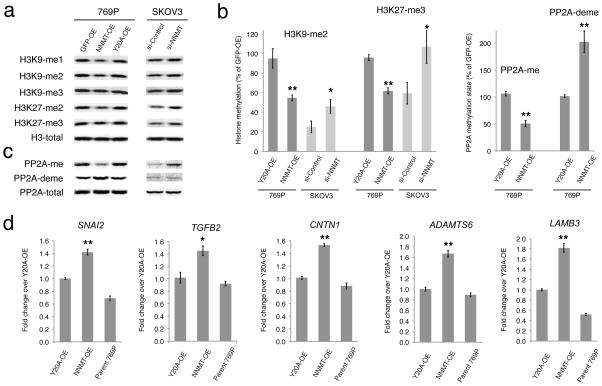
Nicotinamide N-methyltransferase (NNMT) is overexpressed in a variety of human cancers, where it contributes to tumorigenesis by a mechanism that is still poorly understood. Here we show using metabolomics that NNMT impairs the methylation potential of cancer cells by consuming methyl units from S-adenosyl methionine to create the stable metabolic product 1-methylnicotinamide. As a result, NNMT-expressing cancer cells have an altered epigenetic state that includes hypomethylated histones and other cancer-related proteins combined with heightened expression of protumorigenic gene products. Our findings thus point to a direct mechanistic link between the deregulation of a metabolic enzyme and widespread changes in the methylation landscape of cancer cells.


Conflict of interest statement

Competing Financial Interests Statement.

The authors have no competing financial interest.

Figures

FIGURE 1
FIGURE 1. NNMT is elevated in aggressive human cancer cells
(a) NNMT levels and activity are consistently elevated in aggressive human cancer cell lines (red) compared to non-aggressive cancer cell lines (blue), as determined by western blotting with anti-NNMT antibodies (upper panels) and nicotinamide (NA) substrate assays (bar graphs). NNMT activity in H522 cells was below detection limit. (b) Aggressive cancer cells possess higher levels of the NNMT product 1-methylnicotinamide (1MNA). 1MNA levels in H522 cells were below detection limit. (c) Overexpression of NNMT in non-aggressive 769P cells (NNMT-OE) confirmed by WB and NA substrate assay. GFP-OE and Y20A-OE cells correspond to control cancer cell models infected with GFP-vector and a catalytically inactive NNMT mutant (Y20A), respectively. All exogenous proteins contained FLAG-6-His epitope tag and migrated slower on SDS-PAGE compared to endogenous proteins. NNMT-OE cells also showed elevated levels of 1MNA compared to GFP-OE or NNMT-Y20A cells. (d) SKOV3 cells were transiently transfected with the indicated siRNA constructs. A greater than 75% reduction in NNMT was confirmed by western blotting and activity assay in si-NNMT cells compared to si-Control cells transfected with nonsilencing siRNA that has no homology to any known mammalian gene. si-NNMT cells also showed decreased levels of 1MNA. All data shown as mean ± SEM; for metabolomics experiments N = 3–4/group; for substrate assay N = 2/group; * P < 0.05, ** P < 0.01 for NNMT-OE versus control (GFP-OE and Y20A-OE) groups or for si-NNMT versus si-Control groups. See Supplementary Fig. 13 for full gel images.
FIGURE 2
FIGURE 2. Structural assignment of 1MNA and SAH as deregulated metabolites in NNMT-OE cells
(a) Comparative metabolomics of NNMT-OE and GFP-OE cancer lines. Venn diagram showing the number of metabolites commonly and significantly deregulated in three NNMT-OE cancer lines compared to their respective GFP-OE control cells. Two metabolites were identified as significantly different, based on showing a > 2-fold change in level in NNMT-OE compared to GFP-OE cells with a P -value for this difference of < 0.01. (b–f) These two metabolites were identified as 1MNA and SAH by searching their exact masses (b) against the Human Metabolome Database and comparing their fragmentation patterns (c, d) and LC-migration times (e, f) with synthetic standards. Part b shows bar graphs of quantified values for 1MNA and SAH in a representative pair (769P) of NNMT-OE and GFP-OE cancer cells. Note that for part d, synthetic SAH and endogenous m/z = 385.13 showed identical fragmentation spectra producing 250.08 and 136.06 daughter ions (upper panel). Ions with m/z values of 384.27 and 385.26 observed in SAH fragmentation spectrum are contamination signals as they were also observed in a control (blank) run (bottom panel). (b), data are presented as mean values ± SEM; N = 4 experiments/group; ** P < 0.01 for NNMT-OE versus control GFP-OE group.
FIGURE 3
FIGURE 3. NNMT regulates SAM and SAH levels in cancer cells
(a) Targeted LC-MS with a deuterated internal standard confirmed elevated SAH levels in NNMT-OE cells compared to GFP-OE and Y20A-OE control cells. Data are shown for 769P cells; see Supplementary Fig. 5 for similar data on MUM2C and OVCAR3 cells. (b) Cellular levels of methionine and SAM were much lower in 769P cells cultured for 48 h in 10–20 μM versus 100 μM concentrations of methionine, while SAH levels were less affected. (c) NNMT-OE 769P cells cultured with 10 μM methionine possess significantly lower SAM levels and elevated SAH levels compared to GFP-OE and Y20A-OE cells. (d) si-NNMT cells grown on low (10 μM) methionine exhibit elevated SAM and lower SAH levels compared to si-Control cells. (e) LC-MS profiling of 769P cells treated with d4-labeled 1MNA (d4–1MNA) for 24 h revealed accumulation of d4–1MNA, but no other deuterated metabolites were detected. In contrast, d4-labeled-nicotinamide (d4-NA) was converted by cancer cells into d4–1MNA and several deuterated intermediates in the NAD+ biosynthetic pathway, including NAD+, NADH, and nicotinamide mononucleotide (NMN). For illustration purposes, signal intensities of each metabolite were arbitrarily set to a value of 1; see Supplementary Fig. 9 for actual signal intensity values for each metabolite. For (a–d), data are presented as mean values ± SEM; N = 3–4 experiments/group; * P < 0.05, ** P < 0.01 for NNMT-OE versus control (GFP-OE and Y20A-OE) groups or for si-NNMT versus si-Control groups.
FIGURE 4
FIGURE 4. NNMT regulates the methylation state of histones and other signaling proteins in cancer cells
(a, b) NNMT-OE 769P cells show reductions in histone 3 methylation events compared to GFP-OE and Y20A-OE control cells as determined by Western blotting. Conversely, si-NNMT SKOV3 cells show increases in most of these histone methylation events compared to si-Control cells. (b) Bar graphs quantifying representative methylation changes shown in (a) and (c). (c) NNMT-OE 769P cells show reduced levels of PP2A methylation compared to GFP-OE and Y20A-OE control cells as determined by Western blotting. Conversely, si-NNMT SKOV3 cells show increased levels of PP2A methylation compared to si-Control cells. Lane assignment is defined as in (a). (d) Real-time (RT)-PCR analysis showing upregulation of five cancer-related genes in NNMT-OE compared to Y20A-OE or parental 769P cells. Gene changes were normalized to the average of three housekeeping genes, including ACTB, GAPDH and HPRT1. For all studies, cells were cultured in low (10 μM) methionine medium. All data are presented as mean values ± SEM; For (b), N = 4–6 experiments/group. Western blot band intensity was first normalized to total histone 3 levels, followed by normalization of all samples to GFP-OE control group. * P < 0.05, ** P < 0.01 for NNMT-OE versus control Y20A-OE groups, or for si-NNMT versus si-Control groups. For (d), N = 4 experiments/group. * P < 0.05, ** P < 0.01 for NNMT-OE versus control (Y20A-OE and parental 769P cells) groups. See Supplementary Fig. 14 for full gel images.

Comment in

References

    1. Warburg O. On the origin of cancer cells. Science. 1956;123:309–314. - PubMed
    1. DeBerardinis RJ, Lum JJ, Hatzivassiliou G, Thompson CB. The Biology of Cancer: Metabolic Reprogramming Fuels Cell Growth and Proliferation. Cell Metabolism. 2008;7:11–20. - PubMed
    1. Hsu PP, Sabatini DM. Cancer Cell Metabolism: Warburg and Beyond. Cell. 2008;134:703–707. - PubMed
    1. Hanahan D, Weinberg Robert A. Hallmarks of Cancer: The Next Generation. Cell. 2011;144:646–674. - PubMed
    1. Wellen KE, Thompson CB. A two-way street: reciprocal regulation of metabolism and signalling. Nat Rev Mol Cell Biol. 2012;13:270–276. - PubMed

Publication types