. 2013 Apr;14(4):380-8.
doi: 10.1038/ni.2543. Epub 2013 Mar 3.

Lineage-specific functions of Bcl-6 in immunity and inflammation are mediated by distinct biochemical mechanisms

Affiliations

Lineage-specific functions of Bcl-6 in immunity and inflammation are mediated by distinct biochemical mechanisms

Chuanxin Huang et al. Nat Immunol. 2013 Apr.

Abstract

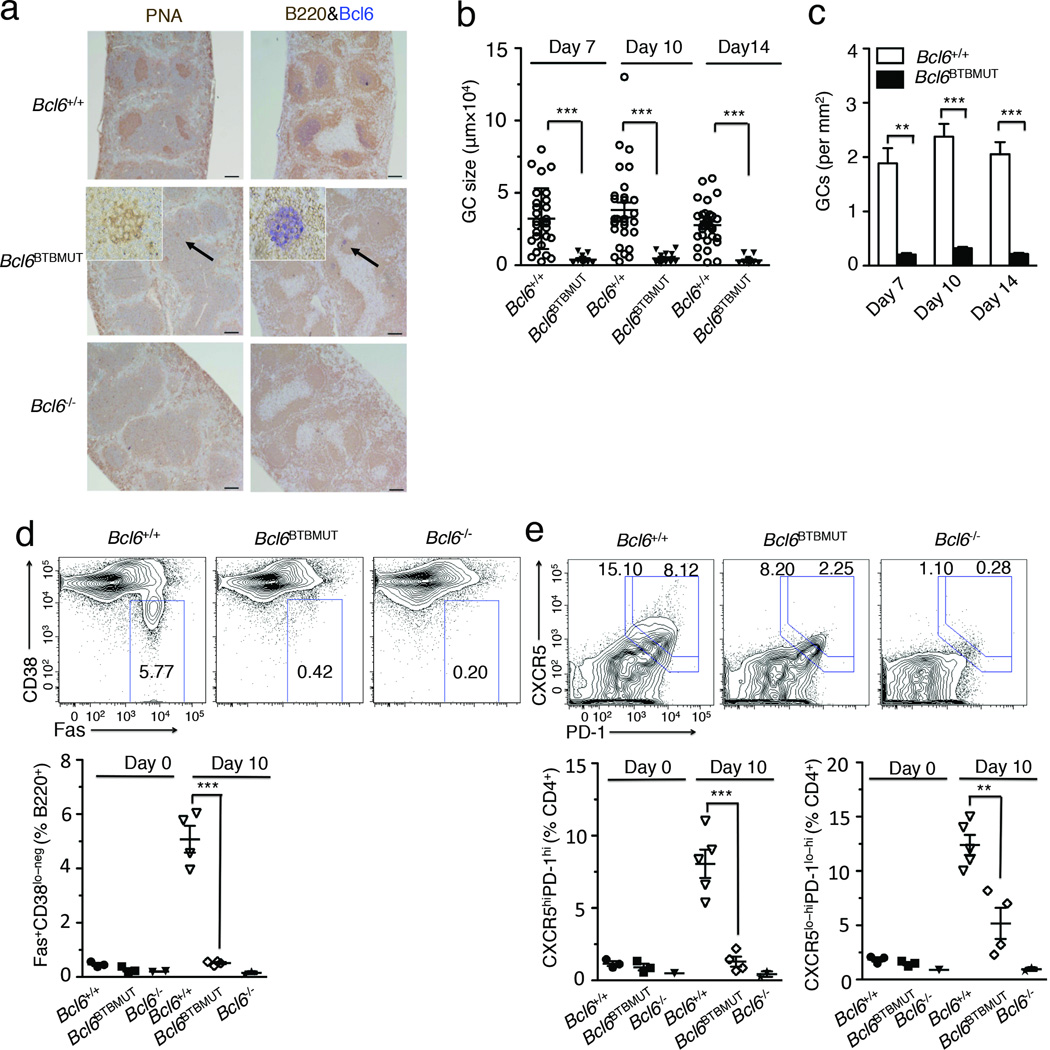
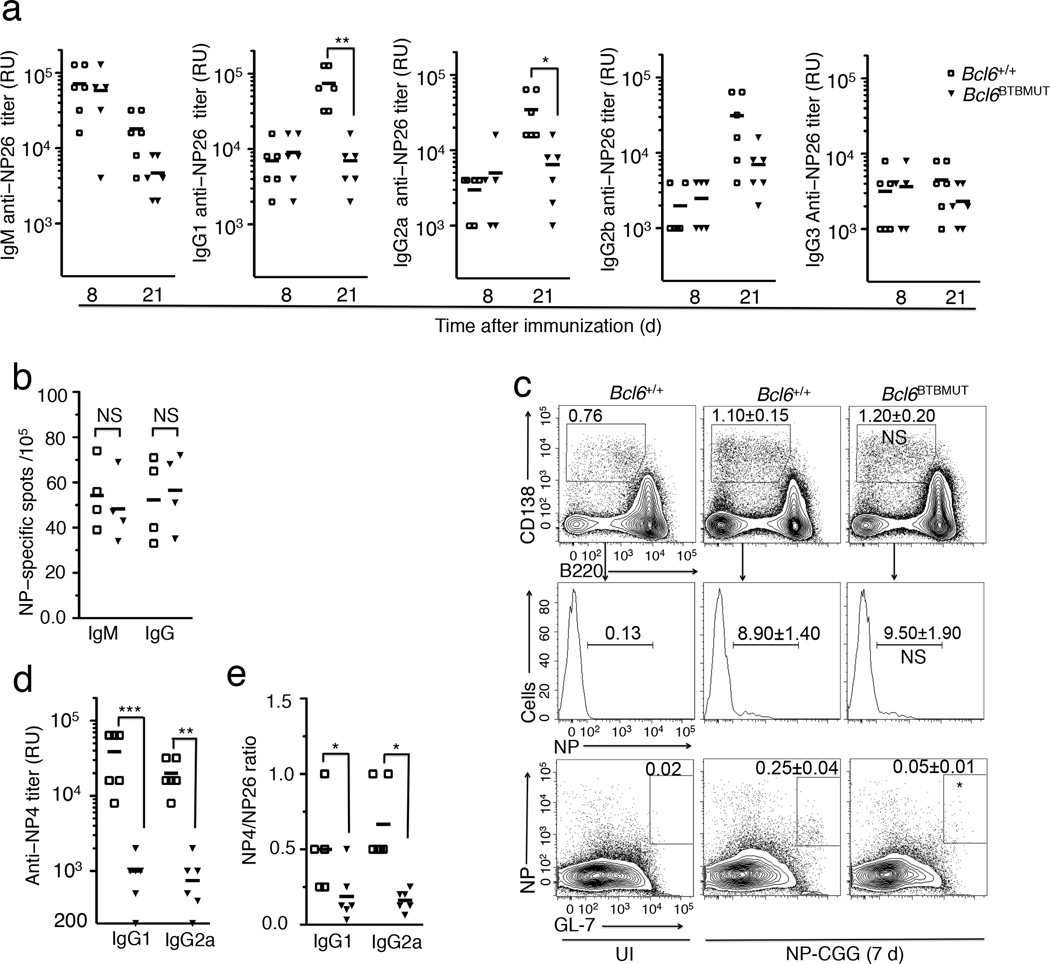
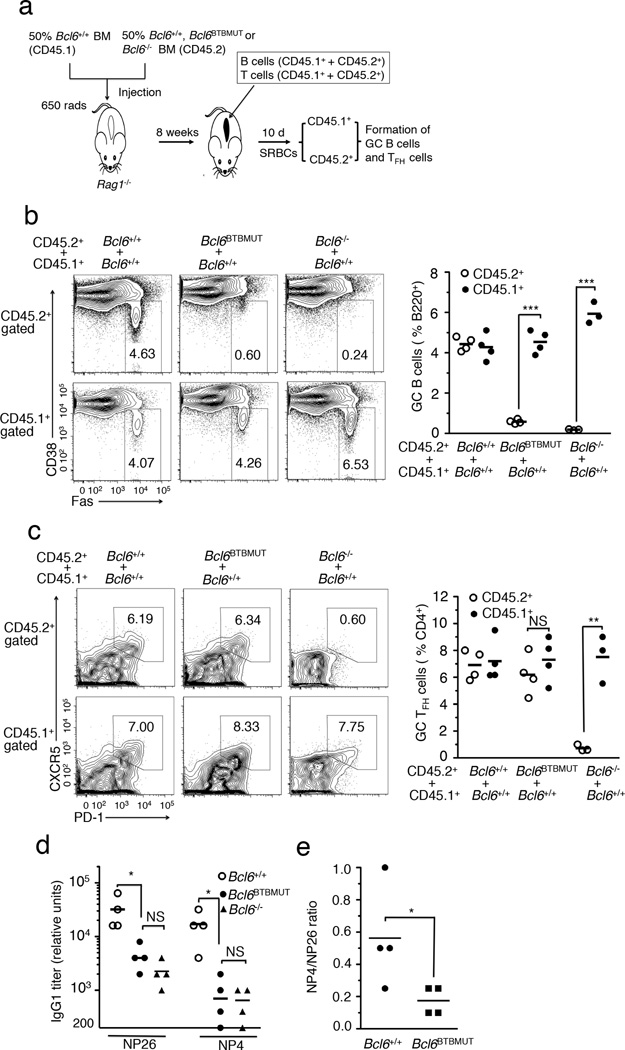
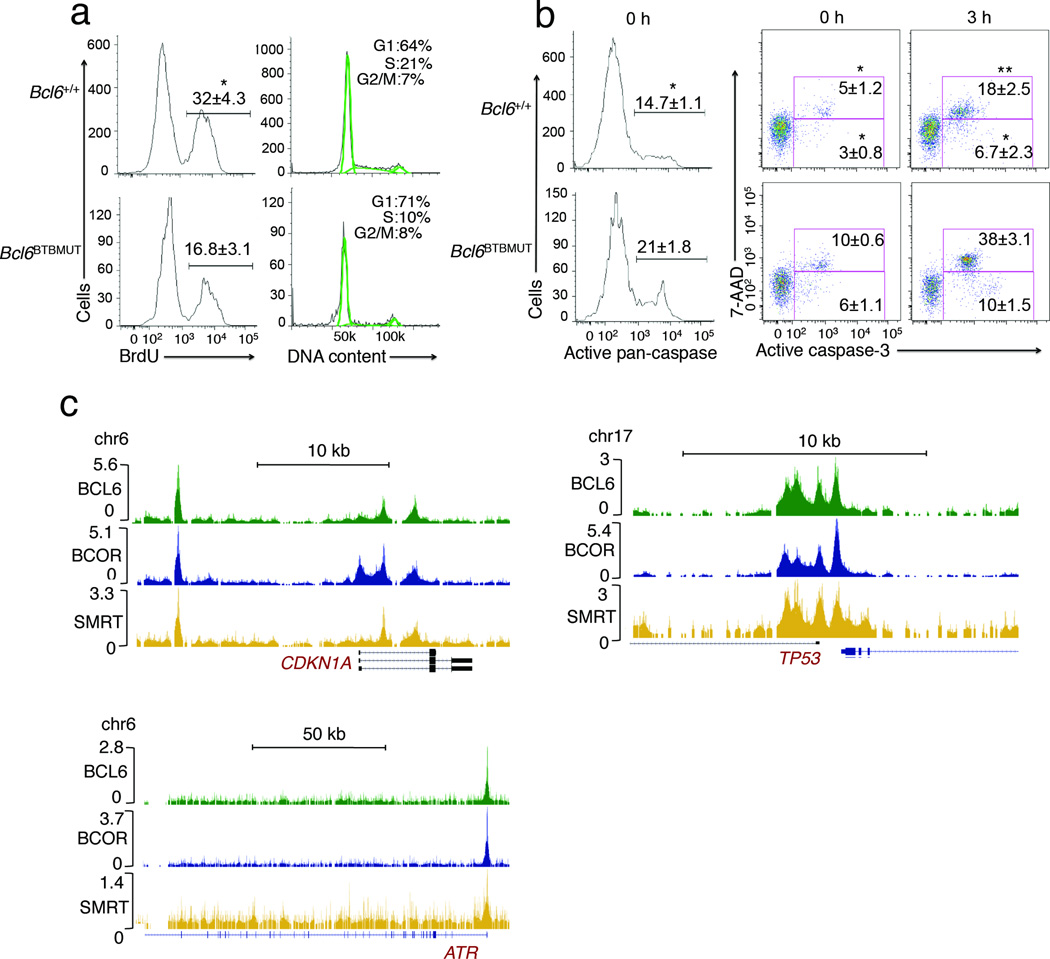
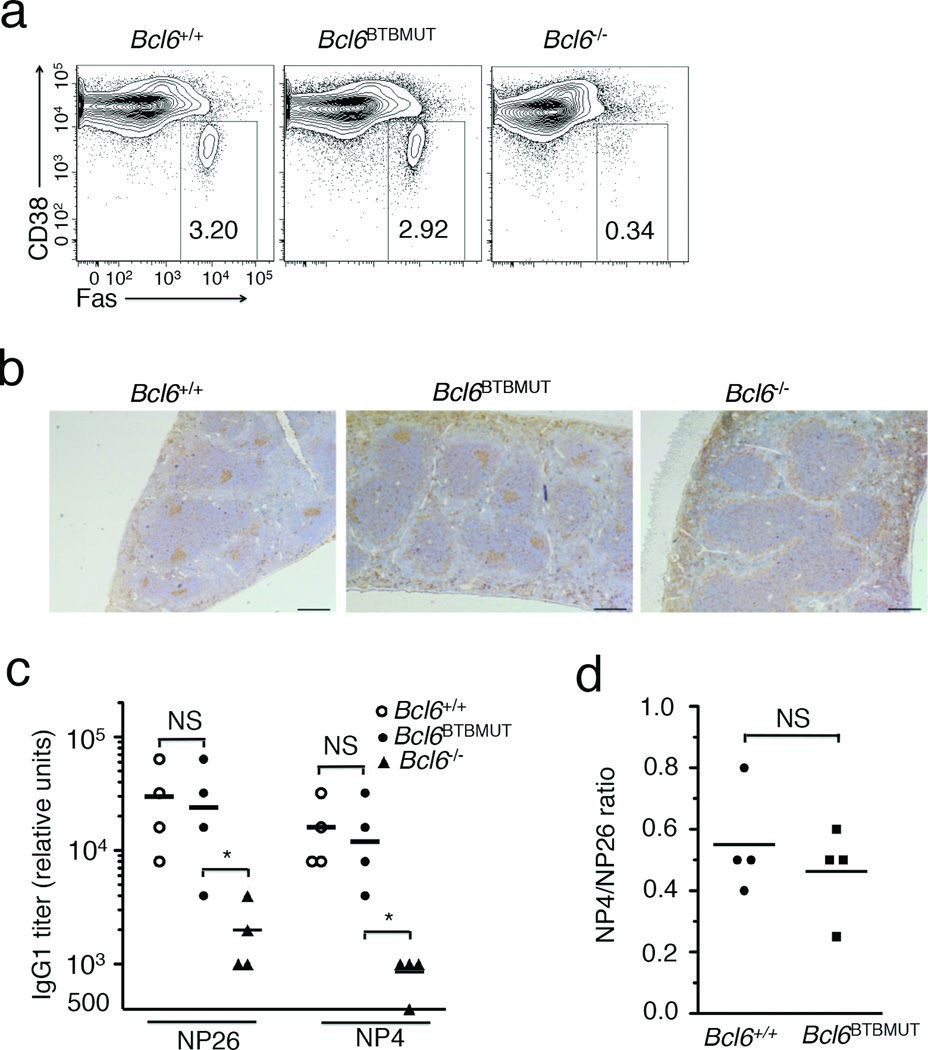
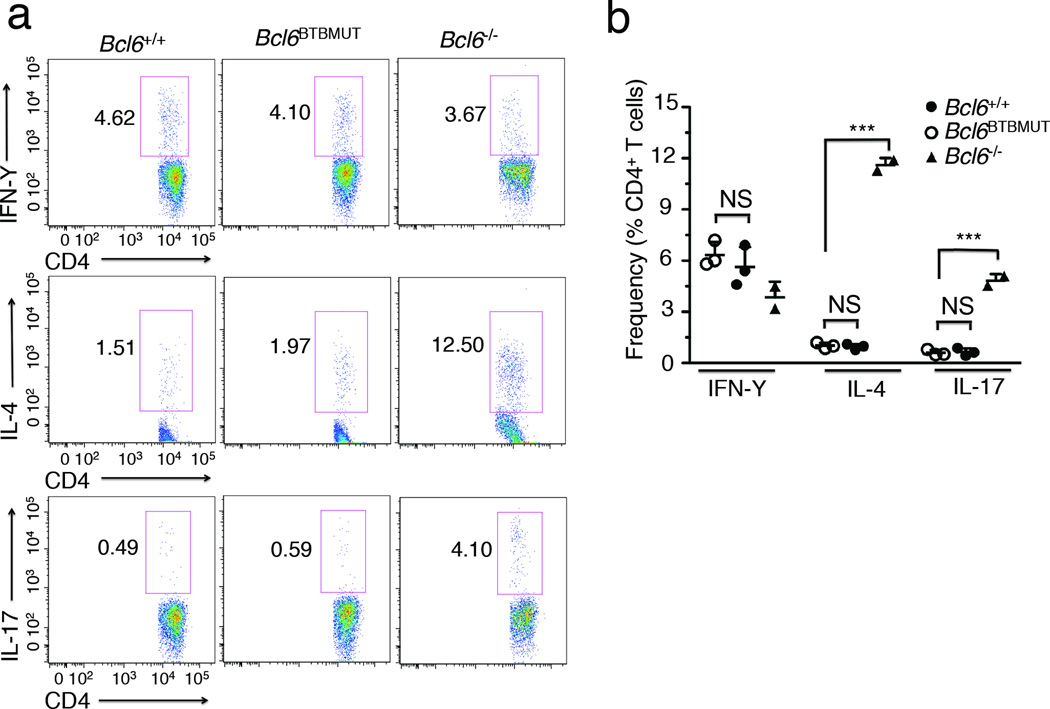
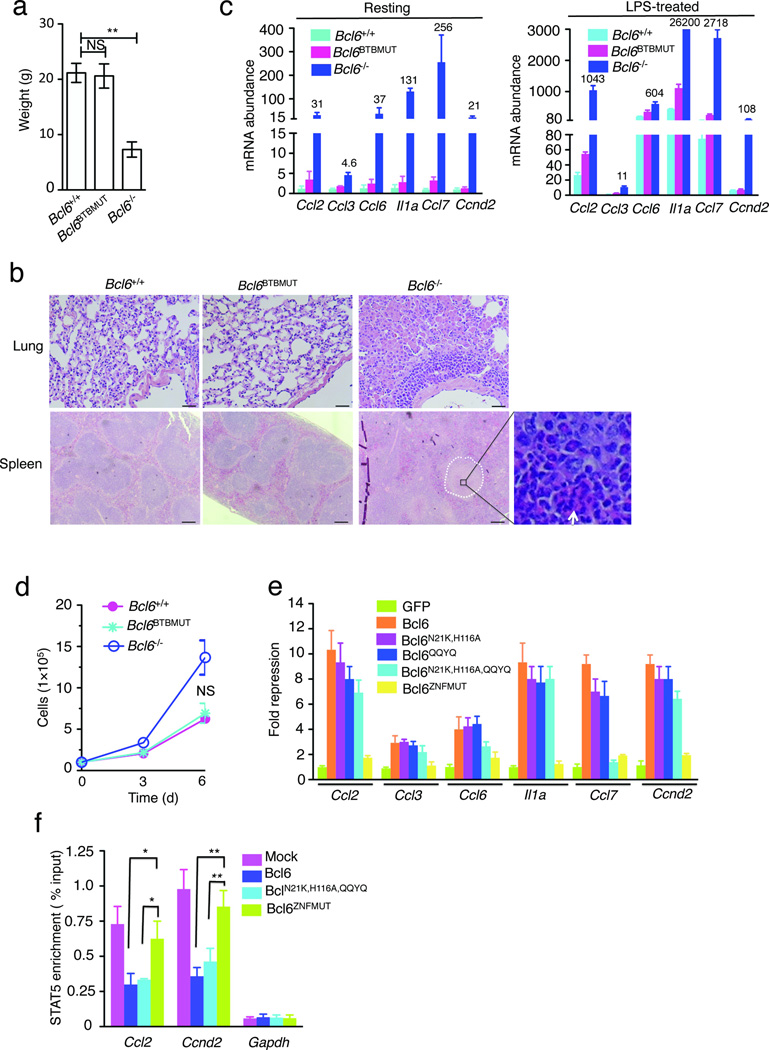
The transcription factor Bcl-6 orchestrates germinal center (GC) reactions through its actions in B cells and T cells and regulates inflammatory signaling in macrophages. Here we found that genetic replacement with mutated Bcl6 encoding Bcl-6 that cannot bind corepressors to its BTB domain resulted in disruption of the formation of GCs and affinity maturation of immunoglobulins due to a defect in the proliferation and survival of B cells. In contrast, loss of function of the BTB domain had no effect on the differentiation and function of follicular helper T cells or that of other helper T cell subsets. Bcl6-null mice had a lethal inflammatory phenotype, whereas mice with a mutant BTB domain had normal healthy lives with no inflammation. The repression of inflammatory responses by Bcl-6 in macrophages was accordingly independent of the repressor function of the BTB domain. Bcl-6 thus mediates its actions through lineage-specific biochemical functions.


Figures

Figure 1
Figure 1. Bcl6BTBMUT knock-in mice markedly reduce germinal centers
(a) Immunohistochemistry of paraffin-embedded serial spleen sections from mice 10 d after immunization with SRBCs. Scale bars, 200 µm. GCs in Bcl6BTBMUT sections were indicated by arrows and shown as inset (original magnification, ×20). Data are representative of over five experiments. (b,c) The size (b) and numbers (c) of GCs in spleen sections of mice 7 d, 10 d and 14 d after immunization with SRBCs. Individual dot represents each GC. Results are from three independent experiments (means and s.e.m. of three mice). (d) Flow cytometric contour plots of GC B cells (FAS+ CD38lo-neg, boxed) gated on live B220+ splenic lymphocytes from mice 10 d after immunization with SRBCs. Bottom, quantification of GC B cells as percent of live B220+ cells in mice before and 10 d after immunization. (e) Flow cytometric contour plots of GC TFH cells (CXCR5hi PD1hi, boxed) and total TFH cells (CXCR5lo-hiPD-1lo-hi, boxed) gated on live B220CD4+ splenic lymphocytes from mice 10 d after immunization with SRBCs. Bottom, quantification of GC TFH and TFH cells as percent of live B220CD4+ cells. Each symbol represents an individual mouse (d,e). Data are representative of three independent experiments (error bars, s.e.m. of two to five mice). ** P<0.01 and ***P<0.001 (two-tailed t-test).
Figure 2
Figure 2. Intact extrafollicular, but impaired germinal center responses in Bcl6BTBMUT mice
(a) Titers of NP-specific immunoglobulin were measured using NP26-BSA in sera of mice 8 d and 21 d after immunization with NP-CGG. RU, relative units. (b) The frequency of NP-specific IgM and IgG secreting cells among splenocytes in mice 7 d after immunization with NP-CGG, assessed by ELISPOT. (c) Flow cytometry for CD138 and B220 expression on live CD11cCD4CD8 spleen cells (top). Small box inserts outline total plasma cells (CD138+B220lo-negCD11cCD4CD8). NP-positive compartment is further gated on total plasma cells (middle). NP-specific GC B cells (NP+GL7+, boxed) are gated on live splenic B220+ cells (bottom). Data are shown as means±s.e.m of three mice. P values were calculated by comparing total plasmas (top), NP+ plasmas (middle) and NP+ GC B cells in Bcl6BTBMUT to those in wild-type. UI, unimmunized. (d) Titers of NP-specific IgG1 and IgG2a measured using NP4-BSA in sera of mice 21 d after immunization with NP-CGG. (e) Ratio of the titers of IgG1 and IgG2a detected with NP4-BSA to those with NP26-BSA. In a, b, d and e, open squares and filled triangles represent wild-type and Bcl6BTBMUT mice. Small horizontal lines indicate means and date are from three independent experiments with four to six mice. NS, not significant; *P<0.05; **P<0.01 and ***P<0.001 (two-tailed t-test).
Figure 3
Figure 3. Bcl6BTBMUT mice show impaired GC response in B cell-autonomous manner
(a) The strategy for generation of chimera using mixed bone marrow transplantation. (b) The frequency of GC B cells (FAS+ CD38low/−, boxed) among live B220+ cells in CD45.1 and CD45.2 donors was quantified by flow cytometry (left) and plotted (right) in chimeras 7 d after immunization with SRBCs. (c) The frequency of GC TFH cells (CXCR5hiPDhi, boxed) among live B220CD4+ T cells in CD45.1 and CD45.2 donors was quantified by flow cytometry (left) and plotted (right). Numbers in outlined areas indicate percent GC B cells (b) and percent GC TFH cells (c). (d,e) Sera were collected from µMT mixed mice 21 d after immunization with NP-CGG, described in Supplementary Fig. 5a. Titers of IgG1 measured with NP26-BSA and NP4-BSA (d). Ratio of the titers of IgG1 detected with NP4-BSA to those with NP26-BSA (e). Each symbol represents an individual mouse and small horizontal lines indicate means (b–e). Data are from three independent experiments with four mice per genotype. NS, not significant; *P<0.05; **P<0.01 and ***P<0.001 (two-tailed t test, b,c and one-tailed t test, d,e).
Figure 4
Figure 4. The Bcl-6 BTB lateral groove is required for GC B cell proliferation and survival
(a,b) Bcl6BTBMUT or Bcl6−/− mice were immunized with SRBCs and the resulting GC B cells examined by flow cytometry for (a) BrdU incorporation (left) and DNA content (right). (b) Active caspae-3 or pan-caspase positive cells were assessed by incubation with FITC-DEVD-FMK or FITC-VAD-FMK respectively and flow cytometry. Dead cells were identified as 7-AAD positive. These assays were performed in fresh isolated (left and middle panels) or ex vivo cultured splenocytes. All plots were gated on splenic FAS+CD38lo-negB220+ GC B cells. Data are from two independent experiments with three to four mice per genotype and shown as means±SD. *P<0.05; **P<0.01 (two-tailed t test). (c) ChIP-seq signals of Bcl-6, SMRT and BCOR in human tonsil germinal center B cells at the ATR, TP53 and CDKN1A gene loci. Data are representative of three independent experiments..
Figure 5
Figure 5. Normal germinal center response in Bcl6BTBMUT, Tcrb−/−Tcrd−/− mixed chimeras
Tcrb−/−Tcrd−/− mixed chimeras were generated as described in Supplementary Fig. 6a. (a,b) Representative flow cytometric contour plots of GC B cells (FAS+ CD38lo-neg, boxed) gated on live splenic B220+ lymphocytes (a) and PNA staining of spleen sections (b) from chimeras 10 d after immunization with SRBCs. Numbers in the outlined box indicate the percentages (a). (c,d) Sera were collected from chimeras 21 d after immunization with NP-CGG. Titers of IgG1 were measured with NP26-BSA and NP4-BSA (c). Ratio of the titers of IgG1 and IgG2a were detected with NP4-BSA to those with NP26-BSA (d). Each symbol represents an individual mouse and small horizontal lines indicate means. Data are representative of three independent experiments with three mice (a,b) and from two independent experiments with four mice (c,d). NS, not significant; *P<0.05 (one-tailed t test, c,d).
Figure 6
Figure 6. Bcl6BTBMUT mice display normal TH2 and TH17 differentiation
(a) Flow cytometric analysis of chemokine production by splenic CD4+ T cells stimulated with PMA (20 ng/ml) and ionomycin (1 µg/ml) in the presence of Golgi-Plug (1 µg/ml) for 5 h before staining for CD4, IL-4, IFN- IL-17. Numbers adjacent to the outlined box indicate the percentages. (b) Quantification of TH1, TH2 and TH17 cells as percentage of CD4+ T cells based on flow cytometry as in a. Each symbol represents an individual mouse. Data are representative of two independent experiments (means ±SD of two to three mice). NS, not significant; ***P<0.001 (two-tailed t test).
Figure 7
Figure 7. Bcl6BTBMUT mice fail to develop TH2-type inflammation disease and display nearly normal inflammation-related gene expression in macrophages
(a) Body weight of indicated mice at eight-weeks old (n=6). (b) Representative hematoxylin and eosin (H&E)-stained lung and spleen sections from indicated mice. Scale bars, 200 µm. Multinodular lesion in Bcl6−/− spleen is marked by white cycle and the infiltration by eosinophils is indicated by arrow in inset (original magnification, ×40). (c) mRNA expression of indicated genes in resting (left) or LPS (5 µg/ml)-treated bone marrow-derived macrophages (BMDMs) cultured from indicated mice (n=3). Data were from three independent experiments and represent as fold-upregulation relative to wild-type resting after normalization with Hprt. Numbers adjacent to blue bars indicate fold in each. (d) Growth curve of BMDMs cultured from indicated mice. (e) mRNA expression of indicated genes in sorted GFP+ population from Bcl6−/− BMDMs infected with a bicistronic retrovirus containing internal ribosomal entry site GFP expressing indicated Bcl-6 forms. Results are shown as fold repression compared to GFP after normalization with Hprt. (f) STAT5 binding at indicated genomic loci in puromycin-resistant Bcl6−/− BMDMs infected with indicated retrovirus. The fold enrichment was calculated as percentage of input. Data represent at least three independent experiments (means ±SD in a, d–f). NS, not significant; *P<0.05 and **P<0.01 (two-tailed t test).

References

    1. Ye BH, et al. Alterations of a zinc finger-encoding gene, BCL-6, in diffuse large-cell lymphoma. Science. 1993;262:747–750. - PubMed
    1. Cattoretti G, et al. BCL-6 protein is expressed in germinal-center B cells. Blood. 1995;86:45–53. - PubMed
    1. Dent AL, Shaffer AL, Yu X, Allman D, Staudt LM. Control of inflammation, cytokine expression, and germinal center formation by BCL-6. Science. 1997;276:589–592. - PubMed
    1. Ye BH, et al. The BCL-6 proto-oncogene controls germinal-centre formation and Th2-type inflammation. Nat Genet. 1997;16:161–170. - PubMed
    1. Fukuda T, et al. Disruption of the Bcl6 gene results in an impaired germinal center formation. J Exp Med. 1997;186:439–448. - PMC - PubMed

Publication types

MeSH terms

Associated data