. 2013 Apr;19(4):458-64.
doi: 10.1038/nm.3108. Epub 2013 Mar 3.

Differential innate immune response programs in neuronal subtypes determine susceptibility to infection in the brain by positive-stranded RNA viruses

Affiliations

Differential innate immune response programs in neuronal subtypes determine susceptibility to infection in the brain by positive-stranded RNA viruses

Hyelim Cho et al. Nat Med. 2013 Apr.

Abstract

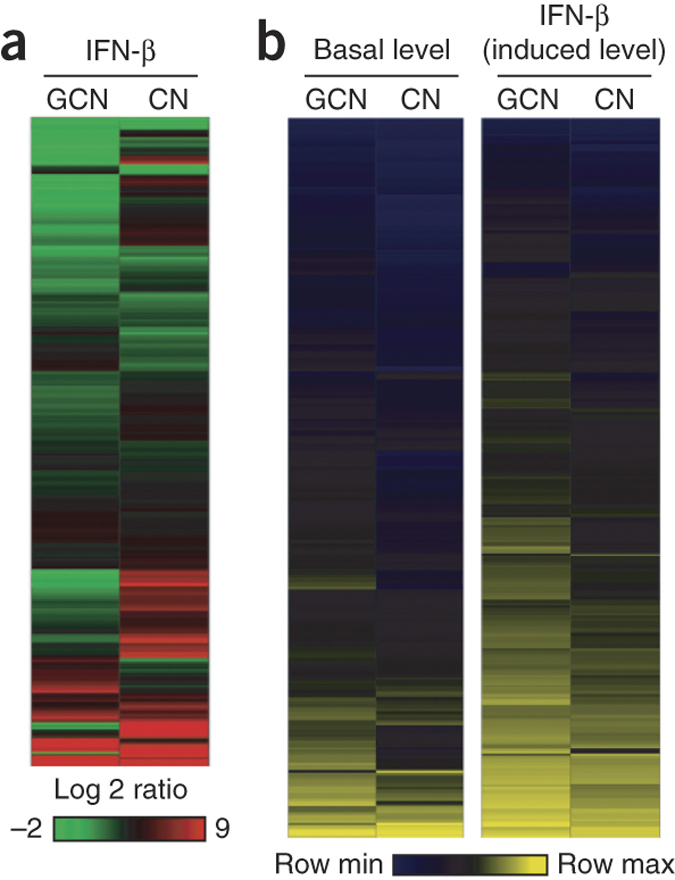
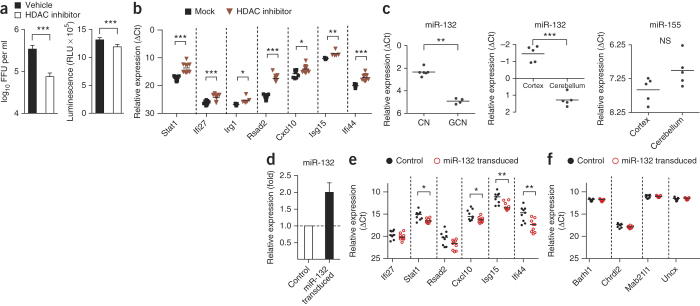
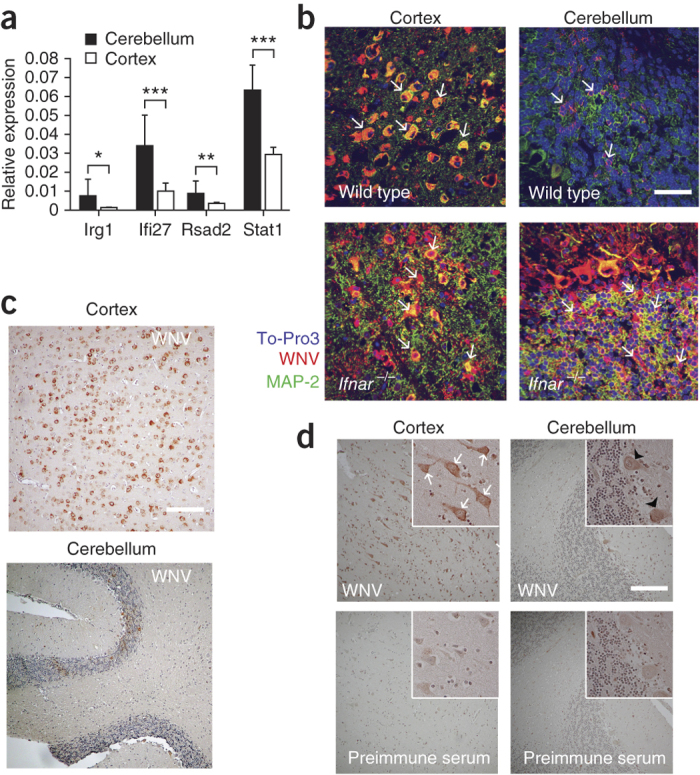
Although susceptibility of neurons in the brain to microbial infection is a major determinant of clinical outcome, little is known about the molecular factors governing this vulnerability. Here we show that two types of neurons from distinct brain regions showed differential permissivity to replication of several positive-stranded RNA viruses. Granule cell neurons of the cerebellum and cortical neurons from the cerebral cortex have unique innate immune programs that confer differential susceptibility to viral infection ex vivo and in vivo. By transducing cortical neurons with genes that were expressed more highly in granule cell neurons, we identified three interferon-stimulated genes (ISGs; Ifi27, Irg1 and Rsad2 (also known as Viperin)) that mediated the antiviral effects against different neurotropic viruses. Moreover, we found that the epigenetic state and microRNA (miRNA)-mediated regulation of ISGs correlates with enhanced antiviral response in granule cell neurons. Thus, neurons from evolutionarily distinct brain regions have unique innate immune signatures, which probably contribute to their relative permissiveness to infection.


Conflict of interest statement

The authors declare no competing financial interests.

Figures

Figure 1
Figure 1. Granule cell neurons are less susceptible to virus infection and more sensitive to the antiviral effects of IFN-β than cortical neurons.
(ae) Virus production of WNV-NY (a), SLEV (b), VEEV (c), MHV (d) and WNV-MAD (e) in primary cortical neurons (CN) and granule cell neurons (GCN) generated from wild-type mice pretreated with medium (Mock) or IFN-β (100 IU ml−1) and infected at a multiplicity of infection (MOI) of 0.1 (WNV-NY and WNV-MAD) or 0.01 (VEEV, SLEV and MHV). (f) Viral replication in granule cell and cortical neurons treated with 20 μg ml−1 of MAR1-5A3 (MAR) monoclonal antibody (mAb) to Ifnar or an isotype control mAb (GIR-208, GIR). Results are the average of three independent experiments performed in triplicate. *P < 0.05, **P < 0.01, ***P < 0.0001 determined by unpaired t test. Error bars, s.d. Dashed lines indicate the limit of sensitivity of the assay. FFU, focus-forming units.
Figure 2
Figure 2. Microarray analysis revealing differential regulation of antiviral genes in granule cell neurons and cortical neurons.
(a) Global view of gene expression 24 h after IFN-β treatment (100 IU ml−1) as determined by clustering performed using the hierarchical unweighted-pair group method using average linkages with a Euclidean distance similarity measure and average value ordering function. The data shown were compared to values from mock-treated cells (fold change). GCN, granule cell neurons; CN, cortical neurons. (b) Differential gene expression profile of IFN-β–responsive genes identified by analysis of variance (ANOVA) (within cutoff values of an at least twofold change, Benjamini-Hochberg–adjusted P < 0.01). Shown are heat maps reflecting the expression of IFN-β–responsive genes (rows) at the basal level (left columns) or after IFN-β treatment (right columns) in granule cell neurons and cortical neurons.
Figure 3
Figure 3. Key ISGs reach peak expression sooner and at higher levels in granule cell neurons.
ΔCt values compared to the cellular levels of 18S ribosomal RNA (top) and fold changes in expression compared to untreated cells (bottom) of the indicated ISGs in granule cell neurons (GCN) and cortical neurons (CN) treated with IFN-β (100 IU ml−1), with cellular RNA harvested at the indicated time points after treatment. The results are the representative of three independent experiments performed in triplicate. Error bars, s.d.
Figure 4
Figure 4. ISGs with antiviral activity identified in neurons using a lentivirus transduction system.
(a) Design of the bicistronic lentiviral vector. CMV, immediate early promoter from human cytomegalovirus; Pubiquitin, ubiquitin promoter; IRES, internal ribosome entry site; R/U5, HIV-1 long-terminal repeat. (b) Flow cytometry contour plots showing Irg1- and Ifi27-mediated inhibition of WNV in primary cortical neurons. The x and y axes indicate transduction efficiency (GFP intensity) and infectivity (level of WNV antigen), respectively. A packaged empty lentiviral vector was used as the negative control. (c) Results of focus-forming assays showing inhibition of WNV replication in cortical neurons transduced with Irf1, Irg1, Ifi27 and Rsad2 but not with several other candidate genes (for example, Ifi204, Pyhin1, Ifitm3, Isg15, Cmpk2, Trim30 or Lcn2). FFU, focus-forming units. (d) Cell viability after lentivirus transduction determined using a Cell-titer Glo luminescence-based assay. RLU, relative light units. (eh) Antiviral effects of Irf1, Irg1, Ifi27 and Rsad2 in cortical neurons against VEEV (e), SLEV (f), WNV-MAD (g) and MHV (h). (i) Viral replication evaluated by focus-forming assay in granule cell neurons transduced with lentiviruses expressing shRNA targeting Irg1, Ifi27 and Rsad2. shRNA targeting GFP was used as a control. For ci, results are the average of at least three independent experiments. *P < 0.05, **P < 0.01, ***P < 0.0001 determined by unpaired t test. Error bars, s.d.
Figure 5
Figure 5. Epigenetic and miRNA-mediated control mechanism of ISGs.
(a) Virus production evaluated by focus-forming assay 12 h after infection in cortical neurons pretreated with the HDAC inhibitor TSA (500 nM) or vehicle (0.1% (vol/vol) DMSO) for 12 h and infected with WNV (MOI of 1) (right). Results are the average of three experiments performed in triplicate. Error bars, s.d. ***P < 0.0001 determined by two-tailed Student's t test. Also shown is cell viability determined using a Cell-titer Glo luminescence-based assay 24 h after TSA treatment (right). FFU, focus-forming units; RLU, relative light units. (b) Expression levels of the indicated genes as determined by qRT-PCR in cortical neurons treated with TSA. The results are the average of three independent experiments performed in at least duplicate. The data are displayed as the ΔCt value compared to the cellular levels of 18S ribosomal RNA. Solid lines represent the median values. *P < 0.05, **P < 0.01, ***P < 0.0001 determined by two-tailed Student's t test. (c) miR-132 expression levels in total RNA isolated from granule cell neurons (GCN) and cortical neurons (CN) quantified by qRT-PCR. The result is representative of four independent experiments with technical replicates of n = 2–6 per experiment. miR-132 and miR-155 (as a control) expression levels quantified by qRT-PCR in total RNA isolated from the cerebellum and cerebral cortex from five naive C57BL/6 mice are also shown. The data are displayed as the ΔCt value compared to the cellular levels of sno202, a small RNA that is commonly used for miRNA normalization. Solid lines indicate the median values. NS, not significant. **P < 0.01, ***P < 0.0001 determined by two-tailed Student's t test. (df) Expression levels of miR-132 (d), ISGs (e) and non-ISGs (f) from total RNA isolated from granule cell neurons transduced with miR-132–expressing lentivirus quantified by qRT-PCR. The miR-132 level was normalized to the cellular level of sno202 RNA, and the levels of ISGs were normalized to the cellular level of 18S ribosomal RNA. Error bars, s.d. Solid lines indicate the median values. *P < 0.05, **P < 0.001, ***P < 0.0001 determined by Mann-Whitney test.
Figure 6
Figure 6. Differential WNV infection of neurons in the brains of mice and humans.
(a) Differential gene expression of Ifi27, Irg1, Rsad2 and Stat1 in the cerebellum and cortex of naive wild-type mice quantified by QuantiGene Plex branched DNA amplification assay. The data were generated from eight mice, and the analysis was performed with triplicate samples for each mouse. Error bars, s.d. *P < 0.05, **P < 0.001, ***P < 0.0001 determined by two-tailed Student's t test. (b) Representative images from the cerebellum and cerebral cortex of wild-type and Ifnar−/− (n = 5 per group) C57BL/6 mice harvested on day 6 after i.c. infection with 101 PFU of WNV and then cryoprotected, sectioned and stained with rat WNV antisera (red), an antibody to the neuronal marker MAP-2 (green) and ToPro-3 (blue) for nuclear staining. White arrows indicate infected cells. Scale bar, 20 μm. (c) Representative images from the cerebellum and cerebral cortex of wild-type C57BL/6 mice harvested at day 6 after i.c. infection with 101 PFU of WNV and then paraffin embedded sectioned, and stained with rat WNV antisera (viral antigen, brown) and haematoxylin for nuclear staining (blue). Scale bar, 80 μm. (d) Brain sections of the cerebral cortex and cerebellum from a fatal human case of WNV encephalitis after staining with rat WNV antisera (viral antigen, brown) or preimmune sera. Infected cortical neurons and Purkinje neurons are indicated by white arrows and black arrowheads, respectively. Scale bar, 80 μm.

References

    1. Ireland DDC, Stohlman SA, Hinton DR, Atkinson R, Bergmann CC. Type I interferons are essential in controlling neurotropic coronavirus infection irrespective of functional CD8 T cells. J. Virol. 2008;82:300–310. - PMC - PubMed
    1. Schoneboom BA, Lee JS, Grieder FB. Early expression of IFN-α/β and iNOS in the brains of Venezuelan equine encephalitis virus–infected mice. J. Interferon Cytokine Res. 2000;20:205–215. - PubMed
    1. McGavern DB, Kang SS. Illuminating viral infections in the nervous system. Nat. Rev. Immunol. 2011;11:318–329. - PMC - PubMed
    1. Delhaye S, et al. Neurons produce type I interferon during viral encephalitis. Proc. Natl. Acad. Sci. USA. 2006;103:7835–7840. - PMC - PubMed
    1. Wang J, Campbell IL. Innate STAT1-dependent genomic response of neurons to the antiviral cytokine α interferon. J. Virol. 2005;79:8295–8302. - PMC - PubMed

Publication types

MeSH terms