

Role of committed minorities in times of crisis
- PMID: 23455718
- PMCID: PMC3586704
- DOI: 10.1038/srep01371
Role of committed minorities in times of crisis
Abstract
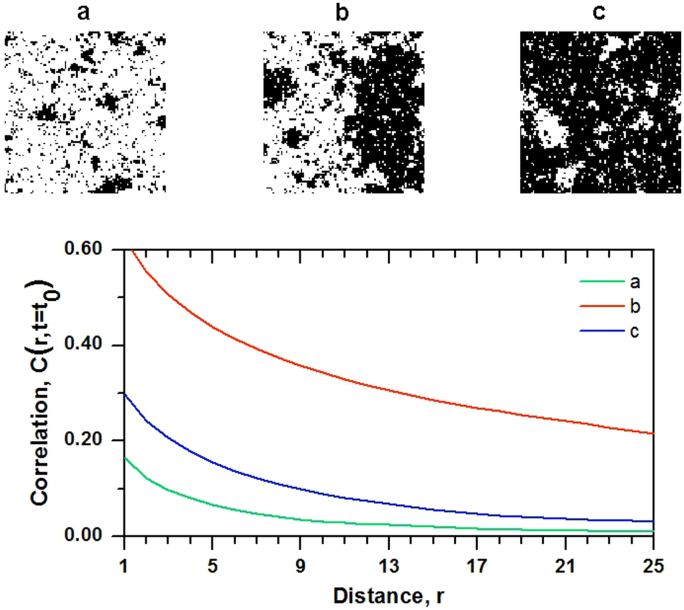
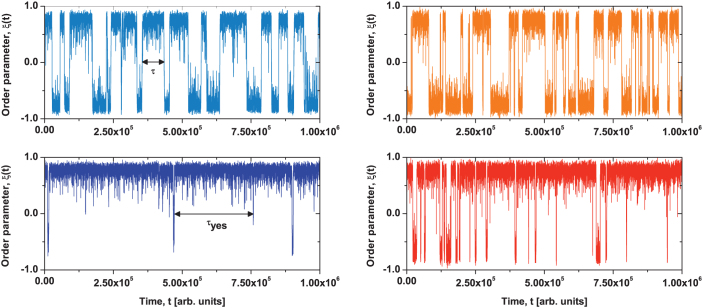
The surprising social phenomena of the Arab Spring and the Occupy Wall Street movement posit the question of whether the active role of committed groups may produce political changes of significant importance. Under what conditions are the convictions of a minority going to dominate the future direction of a society? We address this question with the help of a Cooperative Decision Making model (CDMM) which has been shown to generate consensus through a phase-transition process. We observe that in a system of a finite size the global consensus state is not permanent and times of crisis occur when there is an ambiguity concerning a given social issue. The correlation function within the cooperative system becomes similarly extended as it is observed at criticality. This combination of independence (free will) and long-range correlation makes it possible for very small but committed minorities to produce substantial changes in social consensus.
Figures
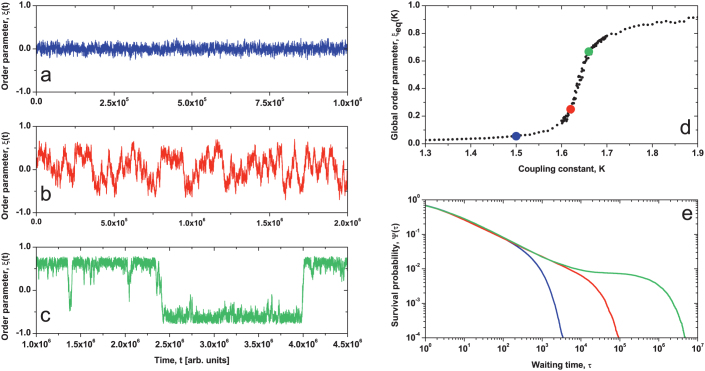
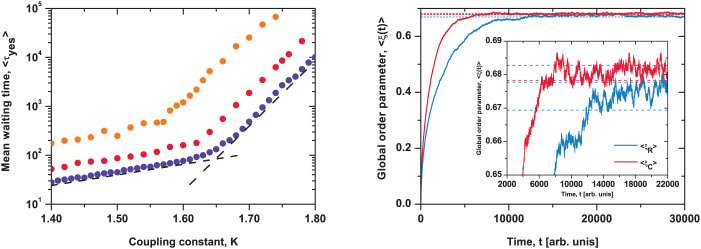
 (blue line) is compared with those initialized with a crisis configuration
  (red curve). Dashed lines correspond to the average value of the ensemble average in the long time limit with one standard deviation of its fluctuations added and subtracted.
Similar articles
-
Committed activists and the reshaping of status-quo social consensus.Phys Rev E Stat Nonlin Soft Matter Phys. 2015 Oct;92(4):042805. doi: 10.1103/PhysRevE.92.042805. Epub 2015 Oct 7. Phys Rev E Stat Nonlin Soft Matter Phys. 2015. PMID: 26565287
-
Social consensus through the influence of committed minorities.Phys Rev E Stat Nonlin Soft Matter Phys. 2011 Jul;84(1 Pt 1):011130. doi: 10.1103/PhysRevE.84.011130. Epub 2011 Jul 22. Phys Rev E Stat Nonlin Soft Matter Phys. 2011. PMID: 21867136
-
The future of Cochrane Neonatal.Early Hum Dev. 2020 Nov;150:105191. doi: 10.1016/j.earlhumdev.2020.105191. Epub 2020 Sep 12. Early Hum Dev. 2020. PMID: 33036834
-
HIV/AIDS: a minority health issue.Med Clin North Am. 2005 Jul;89(4):895-912. doi: 10.1016/j.mcna.2005.03.005. Med Clin North Am. 2005. PMID: 15925655 Review.
-
[The Gulf War Syndrome twenty years on].Encephale. 2013 Oct;39(5):332-8. doi: 10.1016/j.encep.2012.11.003. Epub 2013 Jan 23. Encephale. 2013. PMID: 23351934 Review. French.
Cited by
-
Threshold-limited spreading in social networks with multiple initiators.Sci Rep. 2013;3:2330. doi: 10.1038/srep02330. Sci Rep. 2013. PMID: 23900230 Free PMC article.
-
The Conference of the Birds: An Old Artistic Concept Making Sense in Modern Sciences.Basic Clin Neurosci. 2018 Jul-Aug;9(4):297-305. doi: 10.32598/bcn.9.4.297. Epub 2018 Jul 1. Basic Clin Neurosci. 2018. PMID: 30519388 Free PMC article.
-
Dynamical modelling of street protests using the Yellow Vest Movement and Khabarovsk as case studies.Sci Rep. 2022 Nov 28;12(1):20447. doi: 10.1038/s41598-022-23917-z. Sci Rep. 2022. PMID: 36443352 Free PMC article.
-
Understanding street protests: from a mathematical model to protest management.PLoS One. 2025 Apr 10;20(4):e0319837. doi: 10.1371/journal.pone.0319837. eCollection 2025. PLoS One. 2025. PMID: 40209167 Free PMC article.
-
From Neural and Social Cooperation to the Global Emergence of Cognition.Front Bioeng Biotechnol. 2015 Jun 16;3:78. doi: 10.3389/fbioe.2015.00078. eCollection 2015. Front Bioeng Biotechnol. 2015. PMID: 26137455 Free PMC article. Review.
References
-
- Handy C. M. The Age of Unreason. (Harvard Business Review Press, 1991).
-
- Ball P. Crisis response: The new history. Nature 480, 447–448 (2011). - PubMed
-
- Vespignani A. Complex networks: The fragility of interdependency. Nature 464, 984–985 (2010). - PubMed
-
- Barrat A., Barthelemy M. & Vespignani A. Dynamical processes on complex networks. (Cambridge University Press, 2008).
-
- Haken H. Cooperative phenomena in systems far from thermal equilibrium and in nonphysical systems. Rev. Mod. Phys. 47, 67–121 (1975).
Publication types
LinkOut - more resources
Full Text Sources
Other Literature Sources
