

Review
doi: 10.1152/physiol.00054.2012.
Modern concepts concerning the origin of the heartbeat
Affiliations
- PMID: 23455768
- PMCID: PMC3768086
- DOI: 10.1152/physiol.00054.2012
Item in Clipboard
Review
Modern concepts concerning the origin of the heartbeat
Physiology (Bethesda).
2013 Mar.
Abstract
Physiological processes governing the heart beat have been under investigation for several hundred years. Major advances have been made in the recent past. A review of the present paradigm is presented here, including a look back at important steps that led us to where we are today, alongside a glimpse into the exciting future of pacemaker research.
Figures
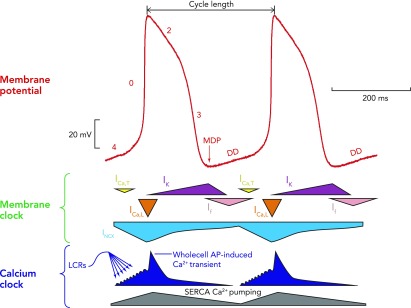
A schematic interplay of different membrane clock and calcium clock mechanisms An example of a typical action potential of spontaneously beating rabbit SANC (red trace; top). The different phases of the AP are labelled. Special note should be taken of phase 4, representing diastolic depolarization, which is the defining feature of cells capable of pacemaking. Schematic representation of the timing and magnitude of the different components of the “membrane clock” is shown in the middle, whereas the timing and magnitude of the different components of the “Ca2+ clock” are shown at the bottom. It can be seen from the bottom (dark blue) that, during phase 4, total cytosolic [Ca2+] gradually builds due to accumulation of Ca2+ in the form of spontaneous local Ca2+ releases emanating from the sarcoplasmic reticulum. Toward the end of diastole, activation of L-type Ca2+ channels causes Ca2+-induced Ca2+ release from the sarcoplasmic reticulum via ryanodine receptors, resulting in the whole cell Ca2+ transient. Cytoplasmic Ca2+ is then removed by both the SR Ca2+ pump, SERCA, and the sarcolemmal sodium-calcium exchanger. MDP, maximum diastolic potential; DD, diastolic depolarization; ICa,T, T-type voltage-dependent Ca2+ current; ICa,L, L-type voltage-dependent Ca2+ current; INCX, sodium-calcium exchange current; IK, delayed rectifier potassium current; If, funny current; SERCA, sarco-endoplasmic reticulum ATPase; LCRs, local Ca2+ releases.
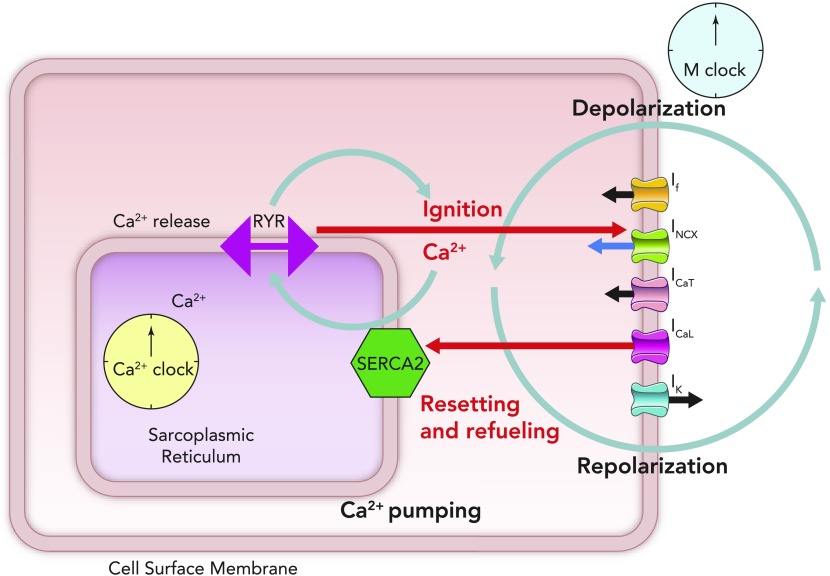
Schematic figure illustrating the cross talk between the membrane clock (right side of schematic SANC) and the Ca2+ clock (lying in the center of the schematic SANC) Online animation reveals schematic behavior of individual ion channels, including the time-dependent nature of the currents that they produce and the coupling of this time- and voltage-dependent behavior to the intracellular Ca2+ clock (see animation at Physiology's website). The movie was created by Victor Maltsev.
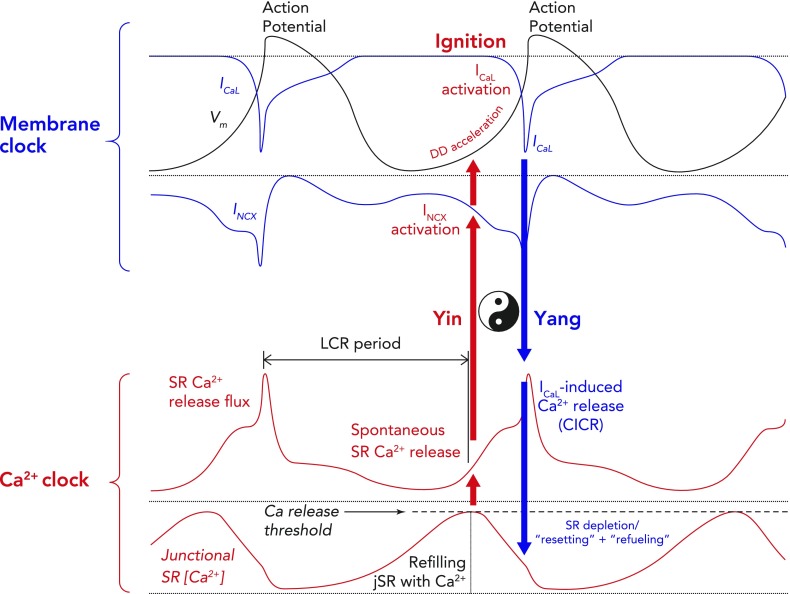
Schematic of computer modeling simulations of the intricate relationship between critical components of the membrane and Ca2+ clocks, with respect to phases of the action potential Two consecutive whole action potentials are illustrated in black at the top. The critical components of the membrane clock are illustrated in blue at the top. ICa,L is depicted as an inward current because its waveform is shown as occurring below the isoelectric line. It can be seen that, during the latter parts of diastolic depolarization, ICa,L activates and rapidly increases to cause the rapid upstroke of the SANC action potential. ICa,L then gradually fades during repolarization until it becomes negligible at the maximum diastolic potential. INCX is also depicted as a blue waveform below the isoelectric line, clarifying that it is an inward current. INCX functions throughout the cardiac cycle, gradually increasing as diastolic depolarization proceeds and peaking in response to the large increase in ICa,L that occurs concomitant with Ca2+-induced Ca2+ release from the SR. The critical components of the Ca2+ clock are illustrated in red at the bottom. SR Ca2+ release flux increases during diastolic depolarization as the signal mass of diastolic LCRs grows. This then peaks as there is en masse activation of RyRs due to their interaction with cytosolic Ca2+ derived from L-type Ca2+ channels, leading to Ca2+-induced Ca2+ release. SR Ca2+ release then falls during repolarization, reaching a nadir at a time similar to (but not the same as) the maximum diastolic potential (Ca2+ nadir usually lagging behind the maximum diastolic potential). Ca2+ release flux then grows once more as the SR is refilled with Ca2+ by SERCA and the threshold for RyR Ca2+ release in the form of LCRs is reached. The concept of the “LCR period” is illustrated as the time taken from the peak of the prior action potential-induced Ca2+ transient to the timing of first release of LCRs (corresponding to the timing of maximal junctional SR Ca2+ content). “Ignition” is the term used to describe the effect of diastolic LCRs that interact with NCX to cause the membrane potential to increase toward the threshold for activation of the L-type Ca2+ current, which “ignites” an action potential. Finally, Ca2+ concentration within the “junctional” SR is depicted in the lowermost red waveform. Junctional refers to the part of the SR that is closest to the sarcolemma (so-called jSR). jSR Ca2+ concentration is at its greatest just before RyRs begin to release diastolic LCRs in early diastole. As the signal mass of LCRs produced increases, so the jSR Ca2+ concentration decreases, reaching a nadir when L-type Ca2+ channel-derived Ca2+ prompts Ca2+-induced Ca2+ release. Following this, the SR gradually refills, courtesy of the action of SERCA, until it once more reaches a peak in early diastole just before the resumption of production of LCRs. Of greater importance than any of the individual component waveforms in this model is the sum of the complex interaction between them. There is a yin-yang relationship between behaviors of the two clocks. For example, as jSR Ca2+ concentration peaks, RyR Ca2+ release flux in the form of LCRs also begins to increase, leading to an increase in INCX and a quickening of the rate of diastolic depolarization (red arrow). As ICa,L reaches its peak just before the peak of the action potential, INCX is also reaching its maximum, as is RyR Ca2+ release flux (CICR), whereas jSR Ca2+ concentration is about to hit rock bottom (blue arrow). These relationships rock back and forth on a beat-to-beat basis to ensure continued automaticity in the coupled clock model.
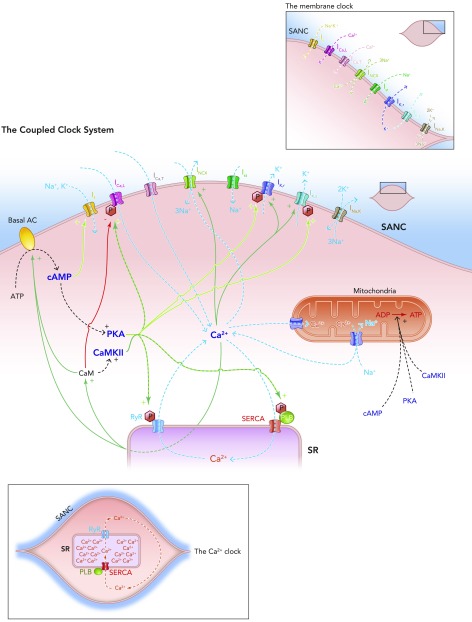
Schematic diagram of the individual elements of the membrane clock (top right) and the Ca2+ clock (bottom left) and how they come together to make up the coupled clock system (middle) The situation under baseline conditions is shown, whereby constitutively active Ca2+-activated ACs produce relatively high levels of cAMP, which go on to activate PKA, in turn leading to relatively high levels of phosphorylation of critical mediators of automaticity belonging to both membrane (ICa,L, IK,r, IK,s) and Ca2+ clocks (RyR, PKA), with the overall result of higher levels of intracellular Ca2+. This elevated Ca2+ then further activates the ACs, and also calmodulin, leading to activation of CAMKII, and so further phosphorylation of critical mediators of automaticity, with the ultimate result of a further increase in intracellular Ca2+; Ca2+ release begets Ca2+ release. This is only maintained at mid-range by constitutively highly active phosphodiesterases and protein phosphatases (see FIGURE 5B).
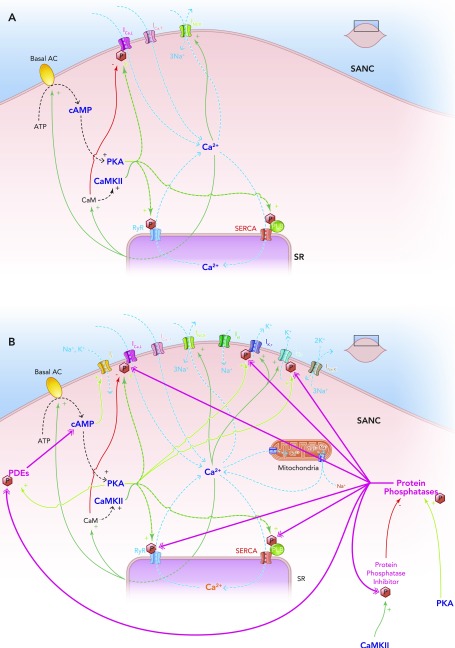
The coupled clock system A: Ca2+ release begets Ca2+ release. A stripped down schematic figure illustrating how, without highly constitutively active phosphodiesterases and protein phosphatases, the coupled clock system would inexorably accelerate itself toward its fastest rate. B: schematic demonstration of the sites of action of the highly constitutively active phosphodiesterases (PDEs) and protein phosphatases (PPs) that keep the coupled clock system in check, allowing it to operate approximately in the mid-range of its capabilities. Note that protein kinase A phosphorylates and activates PDEs, increasing their activity; this is antagonized by the activity of PPs. Protein kinase A also activates PPs directly. Ca2+-calmodulin kinase II phosphorylates and activates protein phosphatase inhibitors, which go on to inhibit PPs, which in turn antagonize the phosphorylating effect of CAMKII on PP inhibitors.
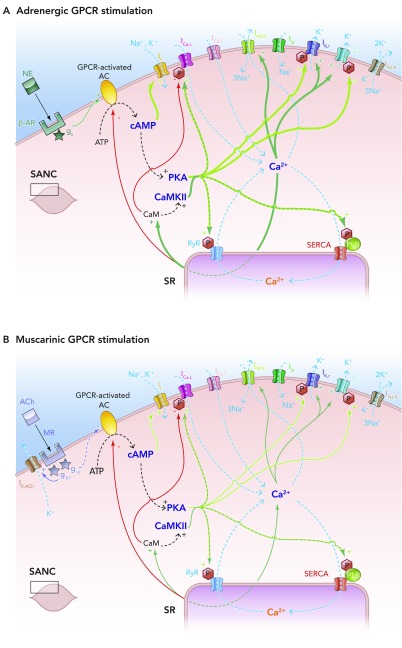
Effects of autonomic nervous system activity on the coupled clock system of pacemaking A: schematic illustration of the effects of adrenergic stimulation on the coupled clock system of pacemaking. In vivo, epinephrine produced from the adrenal glands and norepinephrine from sympathetic nerve terminals binds to β-adrenoceptors, also known as G-protein-coupled receptors. This leads to the Gs subunit activating G-protien-coupled receptor-activated, Ca2+-inhibited adenylate cylases (ACs), which produce cAMP from ATP in additional quantities to that being made by constitutively active, Ca2+-stimulated ACs. This additional cAMP further activates PKA (and If) to lead to an increase in levels of phosphorylation of critical mediators of automaticity belonging to both the membrane and Ca2+ clocks. This in turn leads to the overall levels of intracellular Ca2+ being higher, with subsequently higher levels of activation of calmodulin and thence CAMKII, with more phosphorylation. The ultimate effect is more rapid cycling of greater amounts of Ca2+, and hence an increase in the ticking speed of the coupled clock system. B: schematic illustration of the effects of muscarinic stimulation on the coupled clock system of pacemaking. Acetylcholine (ACh) produced from parasympathetic nerve terminals binds to muscarinic receptors (MR) on SANC (MR also being a form of G-protein-coupled receptors), leading to two predominant effects. The first of these is the direct interaction between the gβγ subunit and IK,ACh, which leads to an outward, repolarizing K+ current. The second effect is that the giα subunit interacts directly with G-protein-coupled receptor-coupled ACs to inhibit these enzymes, causing a decrease in the amount of cAMP produced, with less activation of PKA (and If). Less activation of PKA means that levels of phosphorylation fall, with levels of intracellular Ca2+ falling too. Less intracellular Ca2+ means less activation of CAMKII, so even less phosphorylation. The combined effects of IK,ACh activation and AC inhibition means a slower rate of ticking of the coupled clock system.
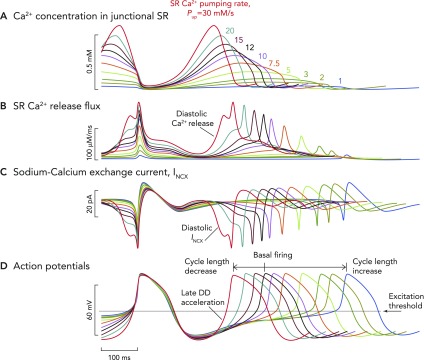
Computer model simulation of a biophysically detailed SANC Computer model simulation of a biophysically detailed SANC incorporating coupled membrane and Ca2+ clock mechanisms of automaticity, illustrating the wide variety of pacing rates that can be achieved simply by varying the pumping rate (Pup) of Ca2+ back into the SR (in vivo, this occurs via the action of the SR ATPase SERCA). Variable SR Ca2+ pumping rates are an index of the degree of phosphorylation of the regulatory molecule phospholamban, which acts as a molecular brake on the pumping rate of SERCA. With increasing degrees of phospholamban phosphorylation, the brake on SERCA functioning is released, and Ca2+ pumping proceeds at a greater rate. The inverse is true when levels of phosphorylation decrease: rate of Ca2+ pumping by SERCA back into the SR decreases. It is likely that the level of phospholamban phosphorylation also reflects the degree of phosphorylation (and therefore activation) of other key mediators of automaticity, including L-type Ca2+ channels, RyRs, and delayed rectifier K+ channels. The maximum rates of SERCA Ca2+ pumping are shown in A. Baseline rates of pumping are shown by the black waveform and are set at rates of 12 mM/s, although they can be varied in the model between 1 and 30 mM/s. A modeled increase in the rate of SERCA Ca2+ pumping causes earlier and larger magnitude Ca2+ release flux from RyRs (B), meaning that, at faster pumping rates, INCX is activated earlier and with a greater magnitude (C). This means that the time to achieve the threshold potential from maximum diastolic potential for the firing of an action potential is progressively shorter. Hence, greater SR Ca2+ pumping rates cause progressively shorter cycle lengths (D). The opposite is true for slower rates of SR Ca2+ pumping: later occurring, smaller RyR Ca2+ release flux, with later occurring, smaller INCX, leading to longer periods of time to achieve threshold potential for firing of an action potential, leading to slower beating rates. Such a mechanism would allow a wide variability in heart rate sufficient to satisfy the majority of demands placed on the system by the organism in vivo.
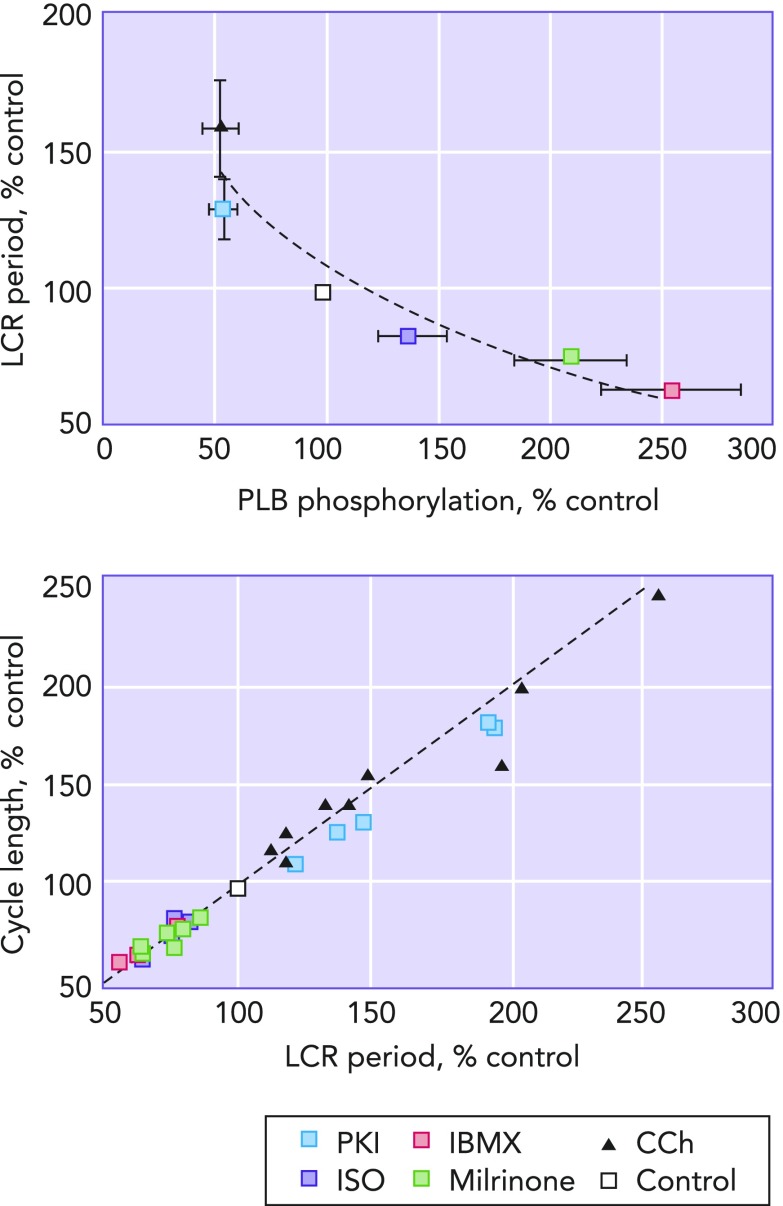
LCR period as the master integrated function of the coupled clock system Left: the relationship between the amount of phospholamban phosphorylation compared to control and LCR period. It can clearly be seen that decreasing the amount of phospholamban phophorylation relative to that present at control (white square) increases LCR period, and, vice-versa, increasing phospholamban phosphorylation relative to control decreases LCR period. Right: a clear and linear relationship passing through the origin between LCR period and cycle length is shown. Image is adapted from Ref. and used per Circulation Research's permissions policy.
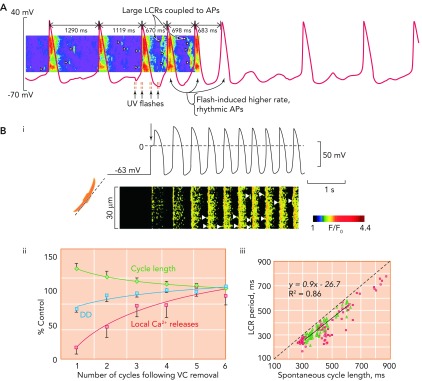
The critical relationship between local Ca2+ release period and cycle length A: exposure of rabbit SANC to a caged Ca2+ buffer causes progressive uncoupling of the tight relationship between LCR period and CL. Note the two long cycles at the start of the trace where LCRs (arrow heads) appear to be randomly scattered between action potentials, which occur at an abnormally slow rate. With UV flashes, Ca2+ is released from the caged buffer, and there is a temporary return to rhythmical, more rapidly occurring action potentials, with large and well organized LCRs occurring in the period befopre the upstroke of the action potential. Gradually, the effect of the flash fades, and the Ca2+ is once more taken up by the buffer, with a return to slower, more irregular action potentials. Image is from Ref. and used with permission from Physiological Reviews. B: Bi shows simultaneous recordings of membrane potential (top) and confocal linescan measured Ca2+ fluorescence (bottom) in a SANC that is acutely released from voltage clamp at −65 mV. The arrow shows the exact moment of release of voltage clamp. It can crudely be seen that there is a progressive increase in beating rate, with a beat-to-beat recovery in LCR signal mass. Bii demonstrates the mean rate of recovery of local Ca2+ releases (red squares), cycle length (green diamonds), and diastolic depolarization rate (blue circles) in 5 SANC following acute release of voltage clamp. There is a high degree of correlation between recovery of LCRs and both increasing rate of diastolic depolarization rate (r2 = 0.78) and decrease in CL (r2 = 0.92). Biii demonstrates the close relationship between LCR period and CL following release of voltage clamp (green triangles). This data is compared with data concerning the relationship between LCR period and CL during spontaneous beating (red squares). Image is from Ref. and used with permission from Biophysical Journal.
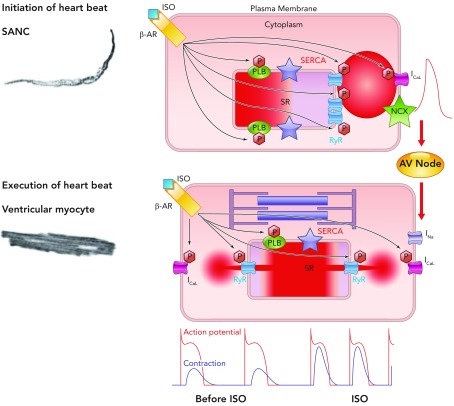
A general theory of cardiac function, involving similar mechanisms in SANC and ventricular myocytes Roughly periodic diastolic Ca2+ releases in the form of LCRs in SANC interact with sarcolemmal NCX to produce an inward current that increases the rate of diastolic depolarization toward the threshold potential for activation of L-type Ca2+ channels. Ca2+ influx through these channels depolarizes SANC and activates RyRs to produce en masse emptying of the SR in a process known as CICR and leads to the action potential-induced Ca2+ transient. Depolarization of SANC spreads via cell-to-cell contacts, leading to depolarization of atrial myocytes and, following conduction via the atrioventricular node, to depolarization of ventricular myocytes. This electrical process involves influx of Na+ ions into ventricular myocytes via fast sodium channels. Depolarization subsequently causes influx into ventricular myocytes of Ca2+ via L-type Ca2+ channels, which again activate SR-based RyRs, leading to en masse emptying of the SR of its Ca2+, which binds to the sarcomere to cause shortening and the ultimate goal of cardiac inotropism. In this schema, the chemical signal of Ca2+ release from the SR in SANC initiates an electrical signal, which is passed to ventricular myocytes. In ventricular myocytes, electrical depolarization then initiates a chemical signal (intracellular Ca2+ release) to produce the ultimate goal: a timely and efficient mechanical oscillation, i.e., a heart beat. Thus heart rate (chronotropy) controlled by SANC leads to execution of a heart beat by ventricular myocytes by utilizing an almost identical set of molecules behaving in the same, albeit differently ordered, manner, a general theory of cardiac function. Increasing or decreasing the rate of activity of SANC in turn increases or decreases the force of contraction of ventricular myocytes via phosphorylation/dephosphorylation of the same molecules (phospholamban, RyR, L-type Ca2+ channels, and delayed rectifier K+ channels) via the same mechanisms involving PKA and CAMKII in these two neighboring yet physiologically diverse cell types (see supplemental movie at Physiology's website; the movie was created by Victor Maltsev).
References
-
- Bakker ML, Boink GJ, Boukens BJ, Verkerk AO, van den Boogaard M, den Haan AD, et al. T-box transcription factor TBX3 reprogrammes mature cardiac myocytes into pacemaker-like cells. Cardiovasc Res 94: 439–449, 2012. - PubMed
-
- Baruscotti M, Bottelli G, Milanesi R, DiFrancesco JC, DiFrancesco D. HCN-related channelopathies. Pflügers Arch 460: 405–415, 2010. - PubMed
-
- Baruscotti M, Bucchi A, DiFrancesco D. Physiology and pharmacology of the cardiac pacemaker (“funny”) current. Pharmacol Ther 107: 59–79, 2005. - PubMed
-
- Bogdanov KY, Vinogradova TM, Lakatta EG. Sinoatrial nodal cell ryanodine receptor and Na+-Ca2+ exchanger: molecular partners in pacemaker regulation. Circ Res 88: 1254–1258, 2001. - PubMed
Publication types
MeSH terms
LinkOut - more resources
Full Text Sources
Other Literature Sources
Molecular Biology Databases
Miscellaneous