. 2013 Jul;33(5):984-90.
doi: 10.1007/s10875-013-9876-3. Epub 2013 Mar 1.

Bioavailability of IgG administered by the subcutaneous route

Affiliations

Bioavailability of IgG administered by the subcutaneous route

Melvin Berger et al. J Clin Immunol. 2013 Jul.

Abstract

Purpose: US licensing studies of subcutaneous IgG (SCIG) calculate dose adjustments necessary to achieve area under the curve (AUC) of serum IgG vs. time on SCIG that is non-inferior to that on intravenous IgG (IVIG), within the FDA-set limit of ±20%. The results are interpreted as showing that different SCIGs differ in bioavailability. We used three approaches to determine if the bioavailabilities were actually different.

Methods: Dose adjustments and AUCs from published licensing studies were used to calculate bioavailabilities using the formula: Bioavailability (% of IVIG) = AUC(SCIG) ÷ AUC(IVIG) x 1/Dose Adjustment. We also compared the increment in serum IgG concentration achieved with varying doses of SCIG in recent meta-analyses with the increment with different doses of IVIG, and determined the serum IgG concentrations when patients switched SCIG products at the same dose.

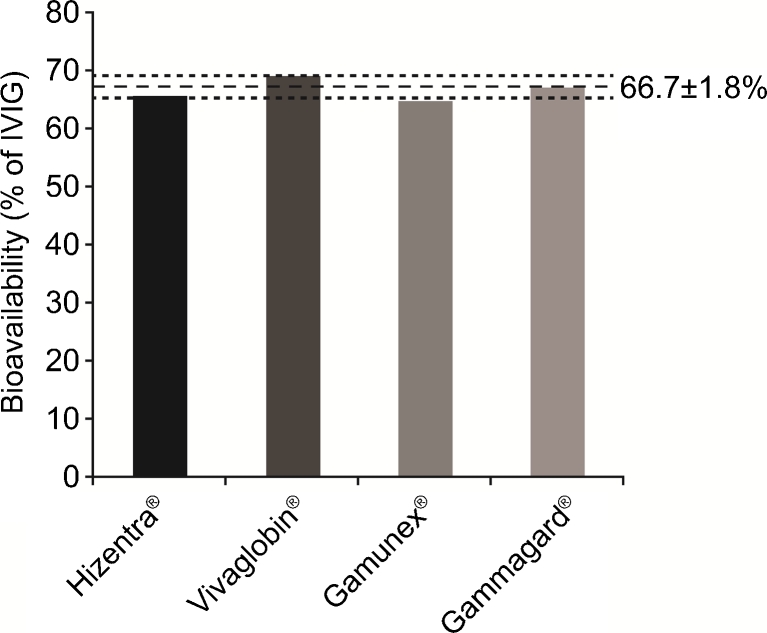
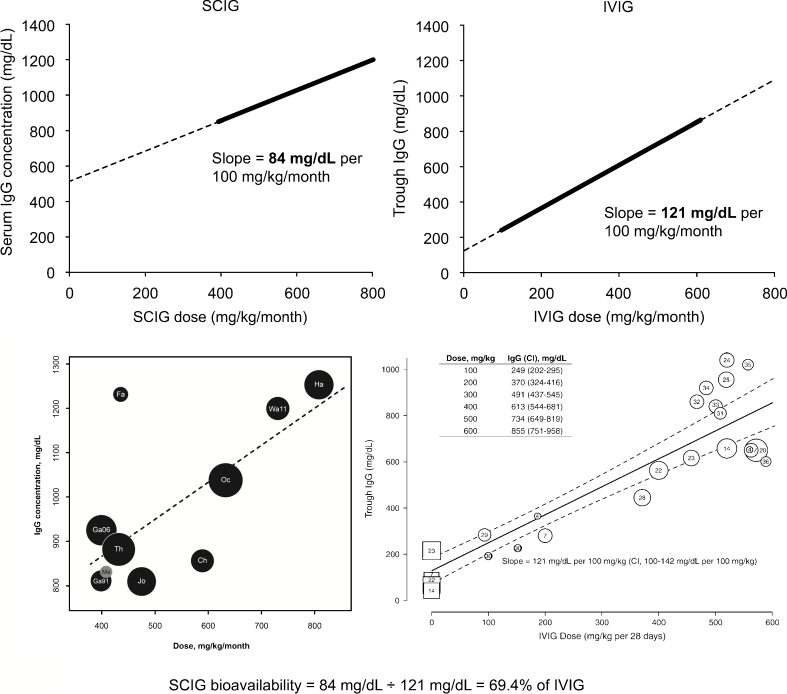
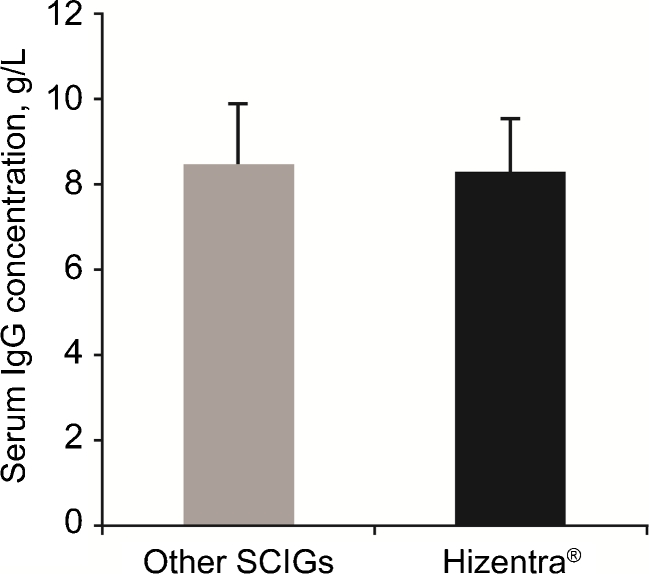
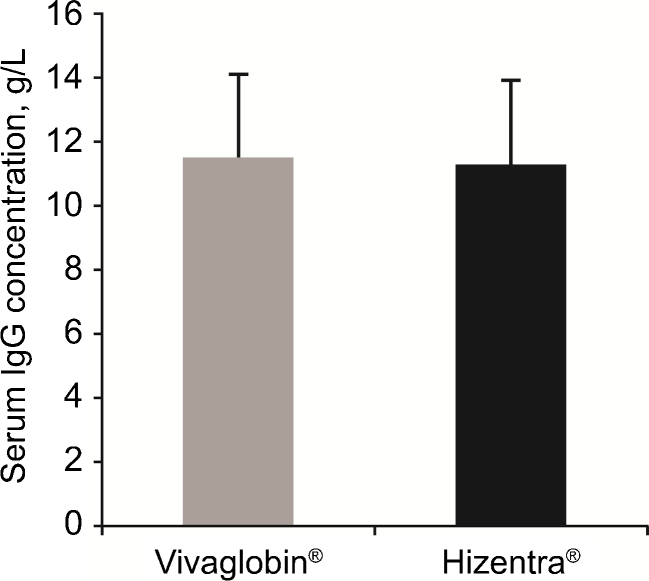
Results: The actual bioavailabilities were: Gamunex® 65.0%, Hizentra® 65.5%, Gammagard® 67.2%, Vivaglobin® 69.0%. Regression analyses of serum IgG vs. dose showed that the mean increase in serum IgG resulting from a 100 mg/kg/month increment in SCIG dosing was 69.4% of the increase with the same increment in IVIG dosing (84 mg/dL vs. 121 mg/dL). Patients switching SCIG preparations at the same dose had no change in serum IgG levels, confirming that bioavailabilities of the SCIG preparations did not differ.

Conclusions: Decreased bioavailability appears to be a basic property of SCIG and not a result of any manufacturing process or concentration. Because serum IgG levels do not vary with different SCIG products at the same dose, adjustments are not necessary when switching products.


Figures

Fig. 1
Fig. 1
Actual bioavailabilities of SCIG products. Bioavailabilities of Hizentra®, Vivaglobin®, Gamunex®, and Gammagard® are shown. The mean bioavailability of the four SCIG products is shown with a horizontal dashed line. Horizontal dotted lines represent SD
Fig. 2
Fig. 2
Linear regression analyses of correlation between IgG doses and trough serum IgG concentration in SCIG- and IVIG-treated PID patients. Linear trendlines representing the dose-related increase in trough serum IgG levels in SCIG- and IVIG-treated PID patients are shown at the same scale to enable comparison (top row). Previously published analyses are also presented at the original scale (bottom row). The thick lines represent the portions of the trendlines corresponding to the data in the original figures. Slope values in mg/dL per 100 mg/kg/month are indicated next to the trendlines. One retrospective SCIG study data (Ma; gray circle) was excluded from the trendline calculation, the others were all prospective. Original figures were reproduced with permission from Orange et al., 2012 [14] and Orange et al., 2010 [13]. The formula used to estimate average SCIG bioavailability is shown below the graphs
Fig. 3
Fig. 3
Serum IgG levels reported in an EU study in PID patients switched from other SCIG products to equivalent doses of Hizentra®. Mean (n = 19) serum IgG concentration measured 3–6 months before switching from other SCIG products (Vivaglobin®, Subcuvia® or Gammanorm®) to Hizentra® was not different from that measured during 16 weeks of Hizentra® treatment. Error bars represent SD
Fig. 4
Fig. 4
Serum IgG levels reported in a US study in PID patients switched from subcutaneous Vivaglobin® to an equivalent dose of Hizentra®. Mean (n = 19) serum IgG concentration measured during Vivaglobin® therapy was not different from that measured during 40 weeks after switching to Hizentra®. Error bars represent SD

References

    1. Aebersold P. Regulatory requirements for subcutaneous Ig for PID. In: Intravenous immunoglobulins in the 21st century: progress and challenges in efficacy, safety and paths to licensure. FDA workshop. 2005. http://www.fda.gov/downloads/BiologicsBloodVaccines/NewsEvents/Workshops.... Accessed 8 Nov 2012.
    1. Wang W, Wang EQ, Balthasar JP. Monoclonal antibody pharmacokinetics and pharmacodynamics. Clin Pharmacol Ther. 2008;84:548–58. doi: 10.1038/clpt.2008.170. - DOI - PubMed
    1. Berger M, Rojavin M, Kiessling P, Zenker O. Pharmacokinetics of subcutaneous immunoglobulin and their use in dosing of replacement therapy in patients with primary immunodeficiencies. Clin Immunol. 2011;139:133–41. doi: 10.1016/j.clim.2011.01.006. - DOI - PubMed
    1. Wasserman RL, Melamed I, Nelson RP, et al. Pharmacokinetics of subcutaneous IgPro20 in patients with primary immunodeficiency. Clin Pharmacokinet. 2011;50:405–14. doi: 10.2165/11587030-000000000-00000. - DOI - PubMed
    1. Wasserman RL, Irani AM, Tracy J, et al. Pharmacokinetics and safety of subcutaneous immune globulin (human), 10 % caprylate/chromatography purified in patients with primary immunodeficiency disease. Clin Exp Immunol. 2010;161:518–26. doi: 10.1111/j.1365-2249.2010.04195.x. - DOI - PMC - PubMed

Publication types

Substances