Comparative Study
. 2013 Jun;43(6):1568-77.
doi: 10.1002/eji.201243262.

Mycobacterium tuberculosis-specific CD8+ T cells are functionally and phenotypically different between latent infection and active disease

Affiliations
Comparative Study

Mycobacterium tuberculosis-specific CD8+ T cells are functionally and phenotypically different between latent infection and active disease

Virginie Rozot et al. Eur J Immunol. 2013 Jun.

Abstract

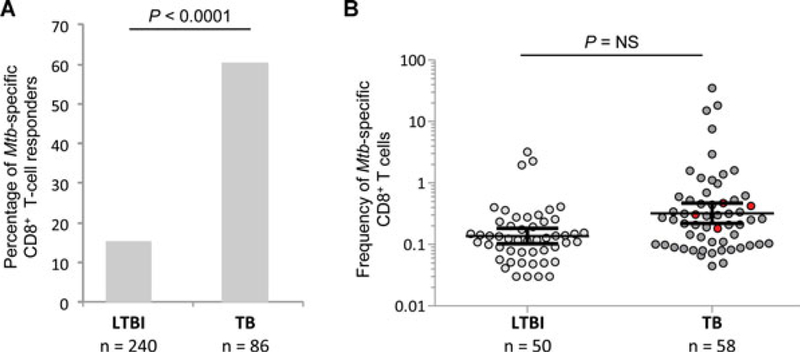
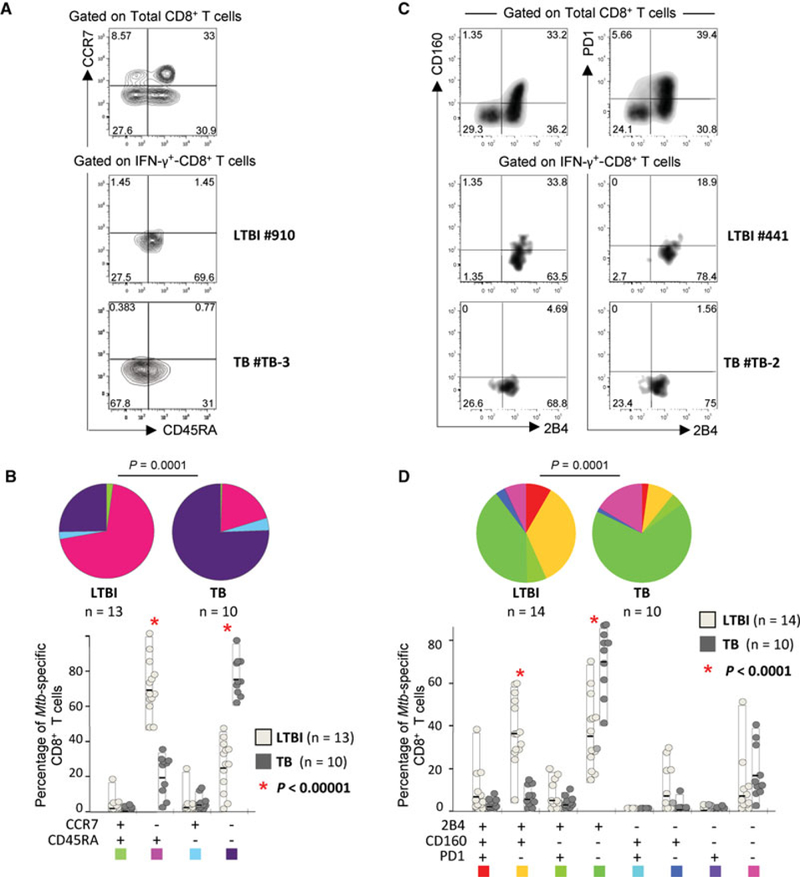
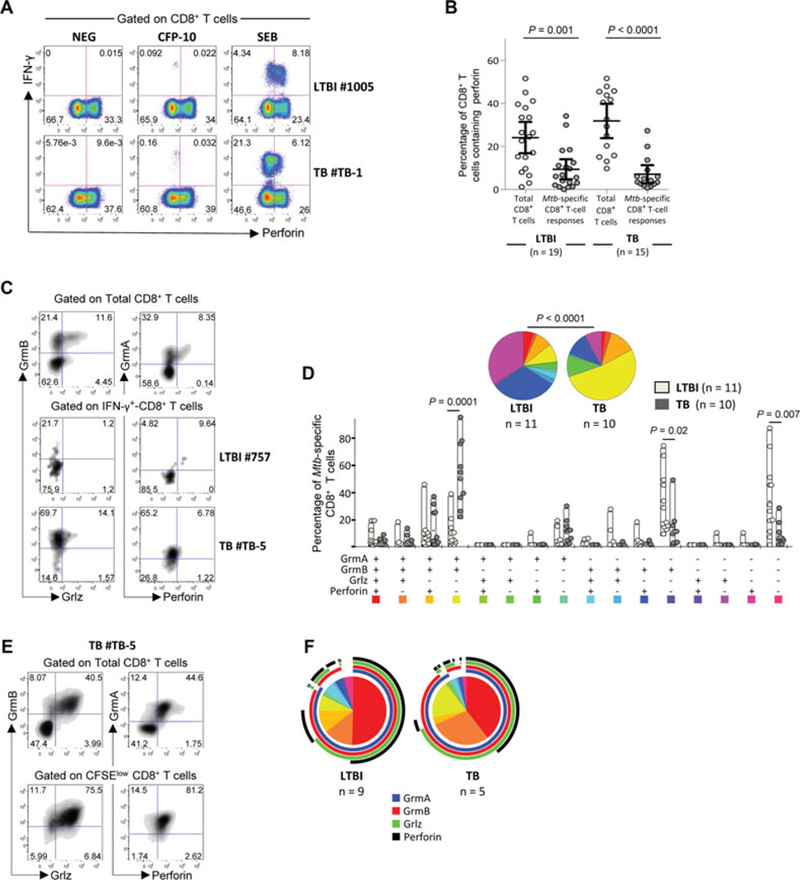
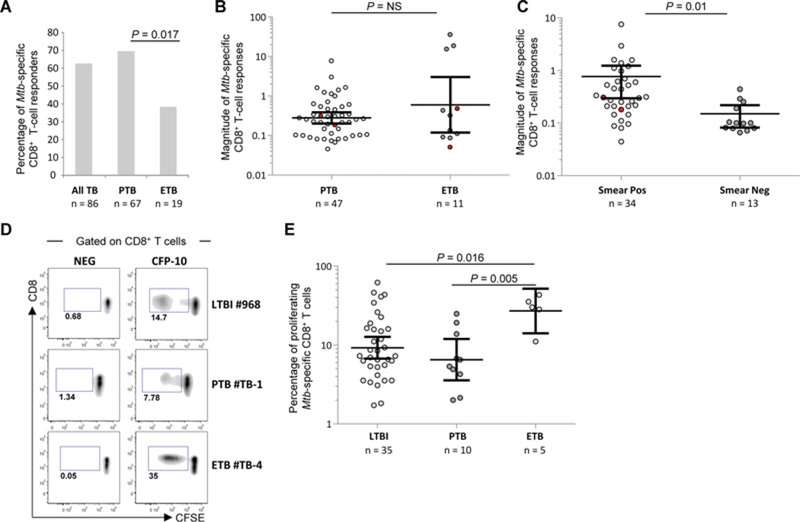
Protective immunity to Mycobacterium tuberculosis (Mtb) remains poorly understood and the role of Mtb-specific CD8(+) T cells is controversial. Here we performed a broad phenotypic and functional characterization of Mtb-specific CD8(+) T cells in 326 subjects with latent Mtb infection (LTBI) or active TB disease (TB). Mtb-specific CD8(+) T cells were detected in most (60%) TB patients and few (15%) LTBI subjects but were of similar magnitude. Mtb-specific CD8(+) T cells in LTBI subjects were mostly T EMRA cells (CD45RA(+) CCR7(-)), coexpressing 2B4 and CD160, and in TB patients were mostly TEM cells (CD45RA(-) CCR7(-)), expressing 2B4 but lacking PD-1 and CD160. The cytokine profile was not significantly different in both groups. Furthermore, Mtb-specific CD8(+) T cells expressed low levels of perforin and granulysin but contained granzymes A and B. However, in vitro-expanded Mtb-specific CD8(+) T cells expressed perforin and granulysin. Finally, Mtb-specific CD8(+) T-cell responses were less frequently detected in extrapulmonary TB compared with pulmonary TB patients. Mtb-specific CD8(+) T-cell proliferation was also greater in patients with extrapulmonary compared with pulmonary TB. Thus, the activity of Mtb infection and clinical presentation are associated with distinct profiles of Mtb-specific CD8(+) T-cell responses. These results provide new insights in the interaction between Mtb and the host immune response.


Conflict of interest statement

Conflict of interest: The authors declare no financial or commercial conflict of interest.

Figures

Figure 1
Figure 1
Detection and magnitude of Mtb-specific CD8+ T-cell responses in LTBI subjects and TB patients: (A) Proportion of LTBI subjects and TB patients with Mtb-specific CD8+ T-cell responses. Statistical significance was calculated using two-tailed Fisher’s exact test. CD8+ T cells were gated as shown in Supporting Information Fig. 1A. (B) Magnitude (mean with 95% CI) of Mtb-specific CD8+ T-cell responses in the 37 LTBI and 52 TB patients with Mtb-specific CD8+ T-cell responses. Mtb-specific CD8+ T-cell responses were defined by the presence of IFN-γ-producing CD8+ CD4 CD3+ T cells following stimulation with ESAT-6 and/or CFP-10 peptide pools. Red points identify Mtb-specific CD8+ T-cell responses from HIV-coinfected subjects. An unpaired two-tailed Student’s t-test was performed.
Figure 2
Figure 2
T-cell differentiation and exhaustion of Mtb-specific CD8+ T cells in LTBI subjects and TB patients. (A) Representative flow cytometry examples and (B) cumulative analyses of the expression of CCR7 and CD45RA on Mtb-specific CD8+ T cells from LTBI subjects and TB patients are shown. CD8+ T cells were gated as shown in Supporting Information Fig. 1A. As in all other flow cytometry analyses from this study, the gating is based on the distribution of the different markers on bulk CD8+ T cells (A; top) and it is then conserved in the analyses of Mtb-specific CD8+ T cells (A; bottom). (C) Representative flow cytometry examples and (D) cumulative analyses of the expression of PD-1, 2B4, and CD160 on Mtb-specific CD8+ T cells from LTBI subjects and TB patients are shown. (A, C) Flow cytometry profiles are gated on live CD3+ CD4 CD8+ T cells and Mtb-specific CD8+ T-cell responses were defined as IFN-γ-producing cells following stimulation with ESAT-6 and/or CFP-10 peptide pools. (B, D) For cumulative analyses, all the possible combinations of the different markers are shown on the x-axis whereas the percentages of the distinct T-cell subsets within Mtb-specific CD8+ T cells are shown on the y-axis. The pie charts summarize the data, and each slice corresponds to the mean proportion of Mtb-specific CD8+ T cells positive for a certain combination of markers. (B, D) Comparisons of markers distribution were performed using a Student’s t-test and a partial permutation test as described [50].
Figure 3
Figure 3
Cytotoxic potential of Mtb-specific CD8+ T-cell responses in LTBI subjects and TB patients. (A) Flow cytometric profiles showing perforin expression on Mtb-specific IFN-γ-producing CD8+ T cells in representative LTBI subjects and TB patients. CD8+ T cells were gated as shown in Supporting Information Fig. 1A. The flow cytometric profiles of unstimulated cells (negative control) and cells stimulated with a polyclonal stimulation (positive control) are also shown. Flow cytometry profiles are gated on live CD3+ CD4 CD8+ T cells and Mtb-specific CD8+ T-cell responses were defined as IFN-γ-producing cells following stimulation with ESAT-6 and/or CFP-10 peptide pools. (B) Percentages (mean with 95% CI) of perforin expression in total- and Mtb-specific CD8+ T cells from LTBI (n = 19) or TB (n = 15) patients. Unpaired two-tailed Student’s t-tests were performed. (C) Representative flow cytometry examples and (D) cumulative analyses of the expression of perforin, granzyme (Grm) B, GrmA, and granulysin (Grlz) on Mtb-specific CD8+ T cells from LTBI subjects and TB patients. All the possible combinations of the different markers are shown on the x-axis whereas the percentages of the distinct T-cell subsets within Mtb-specific CD8+ T cells are shown on the y-axis. (E) Representative flow cytometry example and (F) cumulative analyses of the expression of perforin, GrmB, GrmA, and Grlz on Mtb-specific CD8+ T cells from LTBI subjects and TB patients after 6 days of antigen-specific in vitro T-cell expansion. (D, F) The pie charts summarize the data, and each slice corresponds to the mean proportion of Mtb-specific CD8+ T cells positive for a certain combination of markers identified by the respective arcs. Regarding SPICE analyses, comparison of distributions (D) was performed using a Student’s t-test and a partial permutation test as described [50].
Figure 4
Figure 4
Associations between Mtb-specific CD8+ T-cell responses and clinical presentation. (A) Proportion of patients with Mtb-specific CD8+ T-cell responses in all TB patients (n = 86) and in patients with pulmonary TB (PTB; n = 67) or extrapulmonary TB (ETB; n = 19). Statistical significance was calculated using two-tailed Fisher’s exact test. (B) Magnitude (mean with 95% CI) of the frequency of Mtb-specific IFN-γ-producing CD8+ T-cell responses in PTB (n = 47) and ETB (n = 11) patients with detectable Mtb-specific CD8+ T-cell responses (two-tailed Mann–Whitney test). Red points identify Mtb-specific CD8+ T-cell responses from HIV-coinfected subjects. (C) Magnitude (mean with 95% CI) of the frequency of Mtb-specific IFN-γ-producing CD8+ T-cell responses within PTB patients subdivided into smear-positive (n = 34) and smear-negative (n = 13) patients. Red points identify Mtb-specific CD8+ T-cell responses from HIV-coinfected subjects. (D) Representative flow cytometry examples and (E) cumulative analyses (mean with 95% CI) of the frequency of Mtb-specific CD8+ T cells endowed with proliferation capacity in LTBI (n = 35), PTB (n = 10) and ETB (n = 5) patients. T-cell proliferation was determined using the CFSE dilution assay and profiles are gated on live CD3+ CD8+ CD4 T cells as shown in Supporting Information Fig. 1B. Two-tailed Mann–Whitney tests were performed.

References

    1. Koul A, Arnoult E, Lounis N, Guillemont J and Andries K, The challenge of new drug discovery for tuberculosis. Nature 2011. 469: 483–490. - PubMed
    1. Winthrop KL, Risk and prevention of tuberculosis and other serious opportunistic infections associated with the inhibition of tumor necrosis factor. Nat. Clin. Pract. Rheumatol 2006. 2: 602–610. - PubMed
    1. Bumbacea D, Arend SM, Eyuboglu F, Fishman JA, Goletti D, Ison MG, Jones CE et al. , The risk of tuberculosis in transplant candidates and recipients: a TBNET consensus statement. Eur. Respir. J 2012. 40: 990–1013. - PubMed
    1. Granich R, Akolo C, Gunneberg C, Getahun H, Williams P and Williams B, Prevention of tuberculosis in people living with HIV. Clin. Infect. Dis 2010. 50(Suppl 3): S215–S222. - PubMed
    1. Scanga CA, Mohan VP, Yu K, Joseph H, Tanaka K, Chan J and Flynn JL, Depletion of CD4(+) T cells causes reactivation of murine persistent tuberculosis despite continued expression of interferon gamma and nitric oxide synthase 2. J. Exp. Med 2000. 192: 347–358. - PMC - PubMed

Publication types

MeSH terms