. 2013 May;133(1):157-73.
doi: 10.1093/toxsci/kft035. Epub 2013 Mar 1.

Prenatal bisphenol A exposure alters sex-specific estrogen receptor expression in the neonatal rat hypothalamus and amygdala

Affiliations

Prenatal bisphenol A exposure alters sex-specific estrogen receptor expression in the neonatal rat hypothalamus and amygdala

Jinyan Cao et al. Toxicol Sci. 2013 May.

Abstract

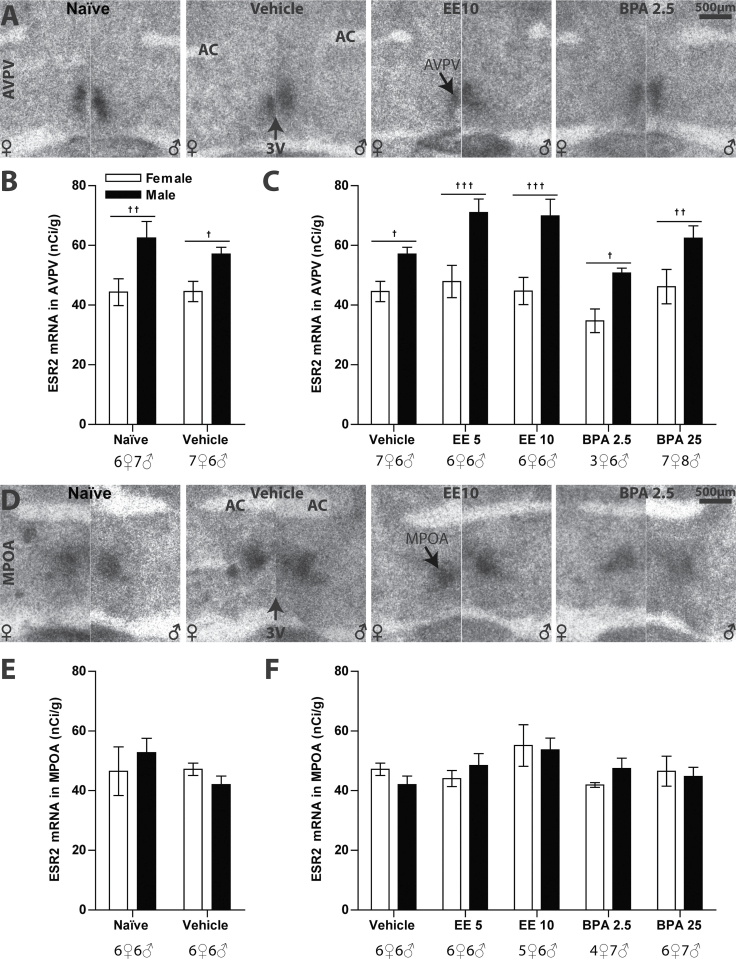
Bisphenol A (BPA) exposure is ubiquitous, and in laboratory animals, early-life BPA exposure has been shown to alter sex-specific neural organization, neuroendocrine physiology, and behavior. The specific mechanisms underlying these brain-related outcomes, however, remain largely unknown, constraining the capacity to ascertain the potential human relevance of neural effects observed in animal models. In the perinatal rat brain, estrogen is masculinizing, suggesting that BPA-induced perturbation of estrogen receptor (ESR) expression may underpin later in-life neuroendocrine effects. We hypothesized that prenatal BPA exposure alters sex-specific ESR1 (ERα) and ESR2 (ERβ) expression in postnatal limbic nuclei. Sprague Dawley rats were mated and gavaged on gestational days (GDs) 6-21 with vehicle, 2.5 or 25 μg/kg bw/day BPA, or 5 or 10 μg/kg bw/day ethinyl estradiol. An additional group was restrained but not gavaged (naïve control). Offspring were sacrificed the day after birth to quantify ESR gene expression throughout the hypothalamus and amygdala by in situ hybridization. Relative to the vehicle group, significant effects of BPA were observed on ESR1 and ESR2 expression throughout the mediobasal hypothalamus and amygdala in both sexes. Significant differences in ESR expression were also observed in the mediobasal hypothalamus and amygdala of the naïve control group compared with the vehicle group, highlighting the potential for gavage to influence gene expression in the developing brain. These results indicate that ESR expression in the neonatal brain of both sexes can be altered by low-dose prenatal BPA exposure.


Figures

Fig. 1.
Fig. 1.
Representative autoradiographs depicting ESR1 mRNA in the AVPV (A) and MPOA (D) from naïve, vehicle, EE 10, and BPA 2.5 exposure groups (from left to right in both A and D, females on the left side of each panel, males on the right). Optical density of ESR1 expression was analyzed in the AVPV (B and C) and MPOA (E and F). A main effect of sex in ESR1 expression was observed in the MPOA by two-way ANOVA, but no effect of exposure was found for either region. A significant sex difference was observed in the naïve control (represented by ††† p ≤ 0.001) but not in other groups. Graphs depict mean ± SEM, and sample size is shown under each group; scale bar = 500 μm for all panels in A and D; 3V = third ventricle; AC = anterior commissure.
Fig. 2.
Fig. 2.
Representative autoradiographs depicting ESR2 signal in the AVPV (A) and MPOA (D). Optical density analysis of ESR2 mRNA in the AVPV (B and C) and MPOA (E and F) indicated that the levels of ESR2 mRNA were sexually dimorphic in the AVPV, with higher levels in males in all groups. No significant effect of EE or BPA was observed in the AVPV or MPOA. Graphs depict mean ± SEM, and sample size is shown under each group. Sex differences in expression are represented by p ≤ 0.05, †† p ≤ 0.01, and ††† p ≤ 0.001; scale bar = 500 μm for all panels in A and D; 3V = third ventricle; AC = anterior commissure.
Fig. 3.
Fig. 3.
Representative autoradiographs depicting ESR1 signal in the rostral (A) and caudal (F) MBH. Optical density analysis in the rARC (B and C) and rVMNvl (D and E) showed that ESR1 mRNA signal in the naïve controls was significantly higher than in the vehicle controls. ESR1 expression in the rARC and rVMNvl was significantly increased in all exposure groups in males, except for EE 5. In females, EE 10 increased ESR1 in rARC and rVMNvl, and BPA 2.5 exposure also significantly increased ESR1 mRNA levels in the female rVMNvl compared with the vehicle control. In the cARC (G and H) and cVMNvl (I and J), ESR1 mRNA levels were significantly higher in the naïve controls than in the vehicle controls. ESR1 expression in the male caudal MBH was significantly increased in all exposure groups, except for EE 5, compared with the vehicle controls. In females, the ESR1 mRNA was significantly increased only in the EE 10 and BPA 2.5 exposure groups. Graphs depict mean ± SEM, and sample size is shown under each group; differences in expression between the naïve and vehicle controls are represented by ***p ≤ 0.001; differences between exposure groups and to their same-sex vehicle controls are indicated by #p ≤ 0.05, ##p ≤ 0.01, and ###p ≤ 0.001 in males and §§ p ≤ 0.01 and §§§ p ≤ 0.001 in females. Sex differences in expression are represented by p ≤ 0.05 and †† p ≤ 0.01; scale bar = 500 μm for all panels in A and F; 3V= third ventricle.
Fig. 4.
Fig. 4.
Representative autoradiographs depicting ESR2 mRNA labeling in the rVMNvl (A) and cVMNvl (D). ESR2 signal was absent in the ARC (A and D). Optical density analysis of ESR2 expression (B, C, E, and F) showed that ESR2 signal in the naïve controls was significantly higher than in the vehicle controls. Compared with the same-sex vehicle controls, ESR2 expression in the rVMNvl and cVMNvl was significantly increased in the EE 10 and BPA 25 exposure groups in both sexes and in the EE 5 group in females (C and F). Graphs depict mean ± SEM and sample size is shown under each group; differences in expression between the naïve and vehicle controls are represented by ***p ≤ 0.001 and between exposure groups and same-sex vehicle controls by ##p ≤ 0.01 and ###p ≤ 0.001 in males, and §§ p ≤ 0.01 and §§§ p ≤ 0.001 in females; p ≤ 0.05, †† p ≤ 0.01, and †††p ≤ 0.001 represent sex differences in ESR2 expression; scale bar= 500 μm; 3V= third ventricle.
Fig. 5.
Fig. 5.
Representative autoradiographs show ESR1 signal in the MePD and PLCo (A). Optical density analysis of ESR1 expression in the MePD (B and C) and PLCo (D and E) revealed that ESR1 mRNA in the naïve controls was significantly higher than in the vehicle controls in both regions. ESR1 expression in both regions was significantly increased in all exposure groups except for EE 5 compared with the vehicle controls. Sexually dimorphic ESR1 expression was not observed in any exposure group in either the MePD or the PLCo. Graphs depict mean ± SEM, and sample size is shown under each group; differences in expression between the naïve and vehicle controls are represented by ***p ≤ 0.001 and between exposure groups and vehicle controls by ##p ≤ 0.01 and ###p ≤ 0.001 in males and §§ p ≤ 0.01 and §§§ p ≤ 0.001 in females in MePD. In PLCo, differences in expression between the exposure groups and vehicle controls are represented by p ≤ 0.05 and ‡‡‡ p ≤ 0.001; scale bar = 1000 µm; 3V = third ventricle.
Fig. 6.
Fig. 6.
Representative autoradiographs showing ESR1 signal in the PMCo and AHi (A). Optical density analysis of ESR1 expression in the PMCo (B and C) and AHi (D and E) revealed that ESR1 mRNA signal in the naïve controls was significantly higher than in the vehicle controls. ESR1 expression in both regions was significantly increased in all groups, except for EE 5, compared with the vehicle controls. Sexually dimorphic ESR1 expression was not observed in any exposure group in either the PMCo or the AHi. Graphs depict mean ± SEM, and sample size is shown under each group; differences in expression between the naïve and vehicle controls are represented by ***p ≤ 0.001 and between exposure groups and vehicle controls by ###p ≤ 0.001; scale bar = 1000 µm; 3V = third ventricle.
Fig. 7.
Fig. 7.
Representative autoradiographs depicting ESR2 signal in the MePD (A). Optical density analysis of ESR2 expression in the MePD (B and C) showed that ESR2 mRNA levels in the naïve controls were markedly higher than in the vehicle controls. ESR2 expression was significantly increased in all exposure groups compared with same-sex vehicle controls in males and was significantly increased in EE and BPA 25 groups in females, and a p value of 0.07 in the BPA 2.5 group. Graphs depict mean ± SEM, and sample size is shown under each group; differences in expression between the naïve and vehicle controls are represented by ***p ≤ 0.001 and between the exposure groups and vehicle controls by ###p ≤ 0.001 in males and § p ≤ 0.05 and §§§ p ≤ 0.001 in females; scale bar = 1000 μm for all panels in A; 3V = third ventricle.

References

    1. Abbott D. H., Zhou R., Bird I. M., Dumesic D. A., Conley A. J. (2008). Fetal programming of adrenal androgen excess: Lessons from a nonhuman primate model of polycystic ovary syndrome. Endocr. Dev. 13, 145–158 - PMC - PubMed
    1. Aksglaede L., Juul A., Leffers H., Skakkebaek N. E., Andersson A. M. (2006). The sensitivity of the child to sex steroids: Possible impact of exogenous estrogens. Hum. Reprod. Update. 12, 341–349 - PubMed
    1. Ashby J., Lefevre P. A. (1997). The weanling male rat as an assay for endocrine disruption: Preliminary observations. Regul. Toxicol. Pharmacol. 26, 330–337 - PubMed
    1. Bai Y., Chang F., Zhou R., Jin P. P., Matsumoto H., Sokabe M., Chen L. (2011). Increase of anteroventral periventricular kisspeptin neurons and generation of E2-induced LH-surge system in male rats exposed perinatally to environmental dose of bisphenol-A. Endocrinology 152, 1562–1571 - PubMed
    1. Balcombe J. P., Barnard N. D., Sandusky C. (2004). Laboratory routines cause animal stress. Contemp. Top. Lab. Anim. Sci. 43, 42–51 - PubMed

Publication types

MeSH terms