. 2012 Nov 1:82:493-511.
doi: 10.1016/j.electacta.2012.03.132.

Hydrogen Peroxide as a Sustainable Energy Carrier: Electrocatalytic Production of Hydrogen Peroxide and the Fuel Cell

Affiliations

Hydrogen Peroxide as a Sustainable Energy Carrier: Electrocatalytic Production of Hydrogen Peroxide and the Fuel Cell

Shunichi Fukuzumi et al. Electrochim Acta. .

Abstract

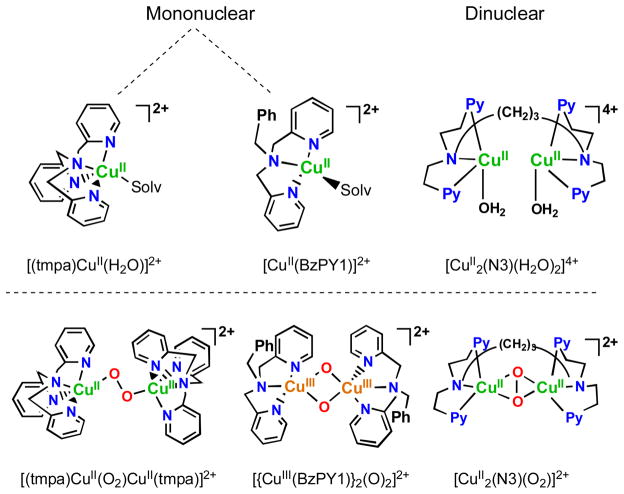
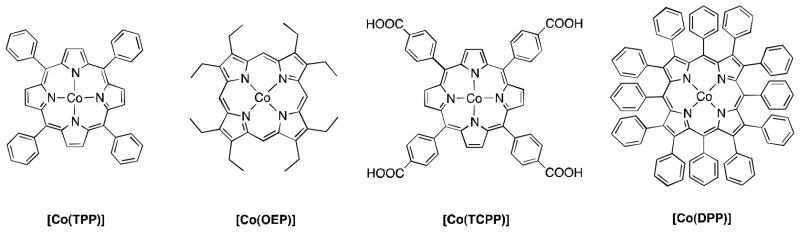
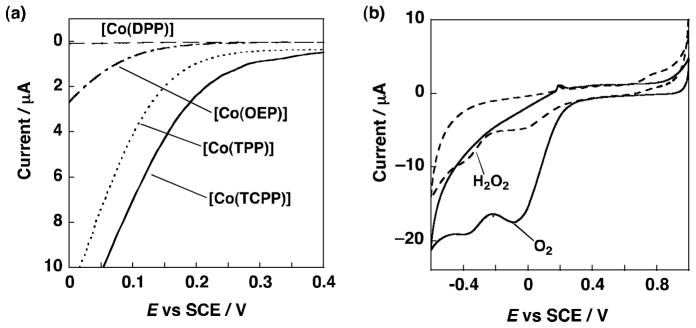
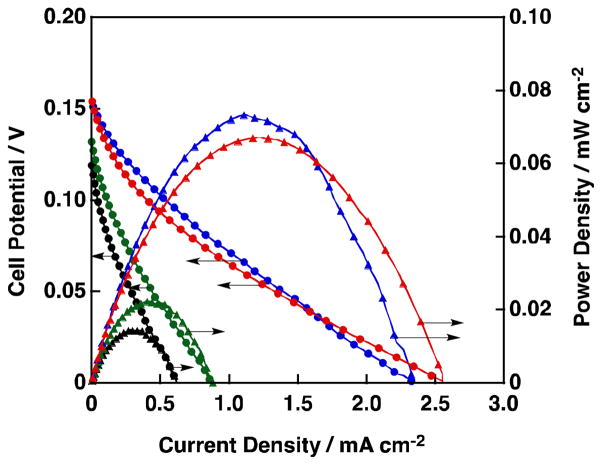
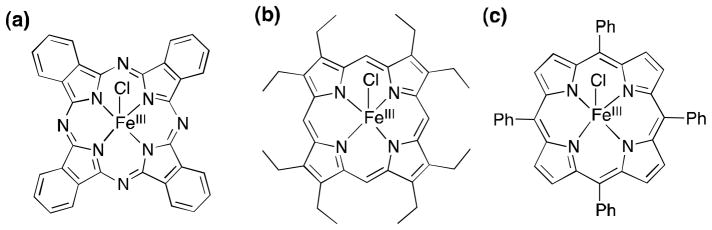
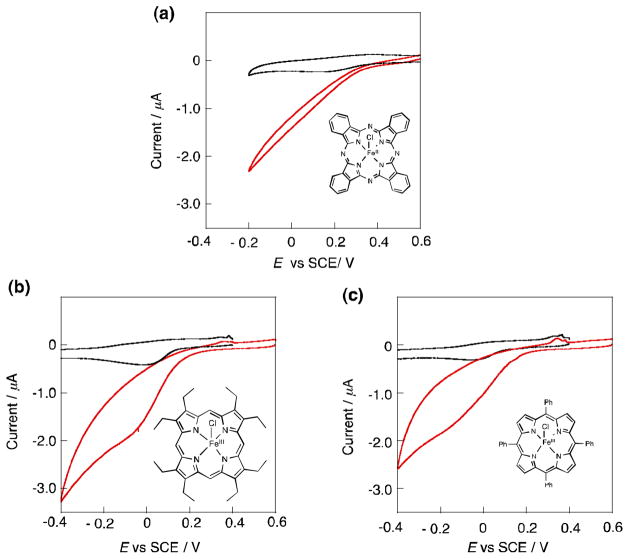
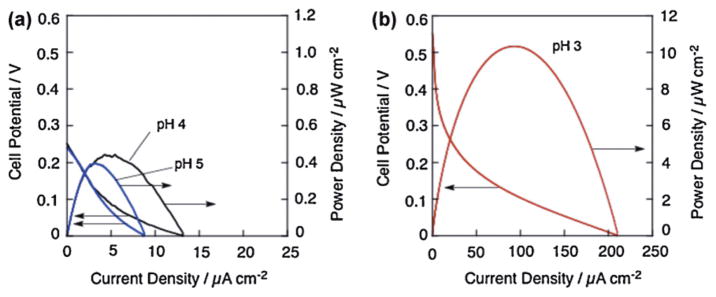
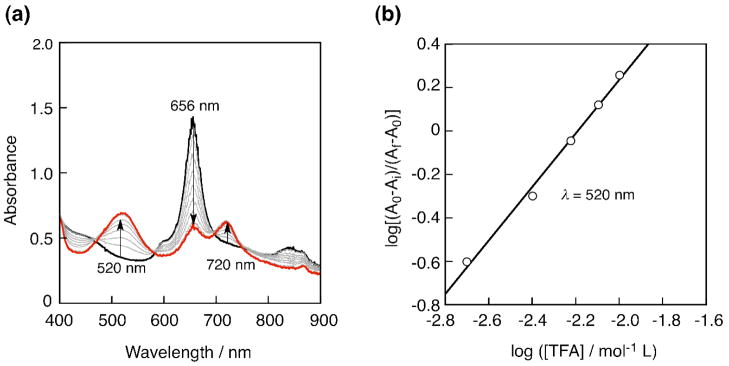
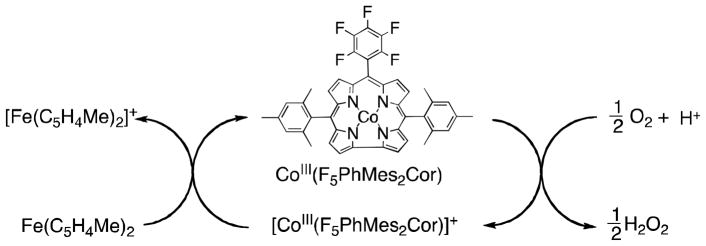
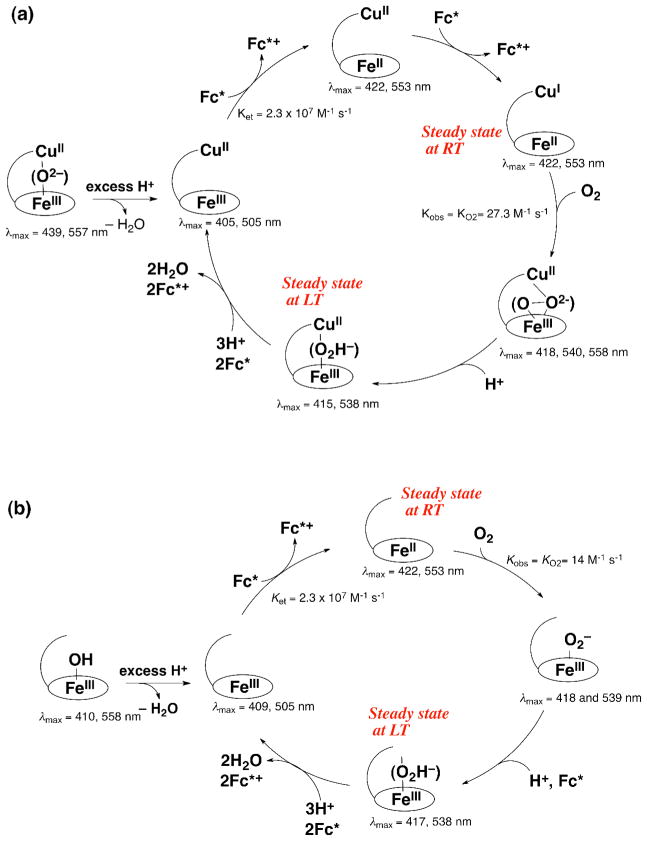
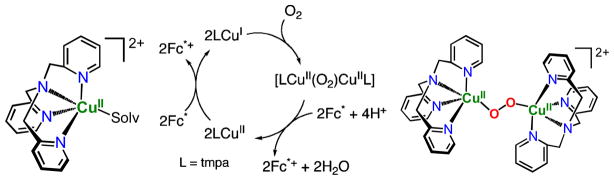
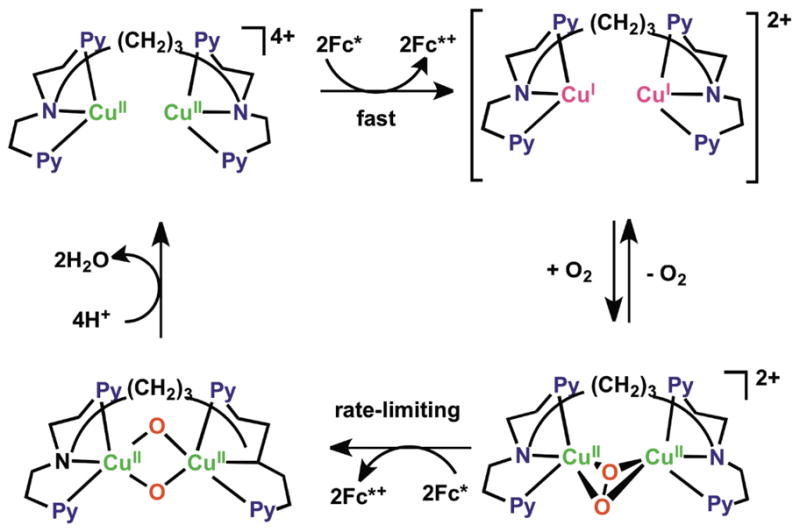
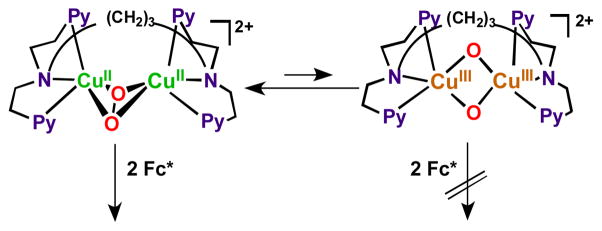
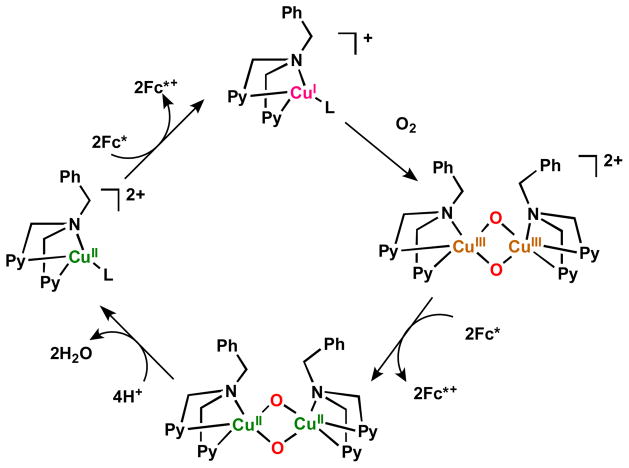
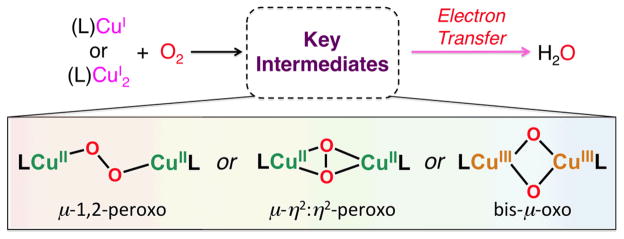
This review describes homogeneous and heterogeneous catalytic reduction of dioxygen with metal complexes focusing on the catalytic two-electron reduction of dioxygen to produce hydrogen peroxide. Whether two-electron reduction of dioxygen to produce hydrogen peroxide or four-electron O2-reduction to produce water occurs depends on the types of metals and ligands that are utilized. Those factors controlling the two processes are discussed in terms of metal-oxygen intermediates involved in the catalysis. Metal complexes acting as catalysts for selective two-electron reduction of oxygen can be utilized as metal complex-modified electrodes in the electrocatalytic reduction to produce hydrogen peroxide. Hydrogen peroxide thus produced can be used as a fuel in a hydrogen peroxide fuel cell. A hydrogen peroxide fuel cell can be operated with a one-compartment structure without a membrane, which is certainly more promising for the development of low-cost fuel cells as compared with two compartment hydrogen fuel cells that require membranes. Hydrogen peroxide is regarded as an environmentally benign energy carrier because it can be produced by the electrocatalytic two-electron reduction of O2, which is abundant in air, using solar cells; the hydrogen peroxide thus produced could then be readily stored and then used as needed to generate electricity through the use of hydrogen peroxide fuel cells.


Figures

Fig. 1
Fig. 1
Time profiles of formation of Fe(C5H4Me)2+ monitored at 650 nm in electron transfer oxidation of Fe(C5H4Me)2 (1.0 × 10⁻¹ mol L−1) by O2 (1.7 × 10⁻³ mol L−1), catalyzed by Co2(DPX) (2.0 × 10⁻⁵ mol L−1), Co2(DPA) (2.0 × 10⁻⁵ mol L−1), Co2(DPB) (2.0 × 10⁻⁵ mol L−1), Co2(DPD) (2.0 × 10⁻⁵ mol L−1), and Co(OEP) (3.0 × 10⁻⁵ mol L−1) in the presence of HClO4 (2.0 × 10⁻² mol L−1) in PhCN at 298 K.
Fig. 2
Fig. 2
Cyclic voltammograms of (a) Co2(DPX) and (b) Co(OEP) (1.0 × 10⁻³ mol L−1) in PhCN containing 0.1 mol L−1 TBAP; scan rate 100 mV s−1.
Fig. 3
Fig. 3
Selected distance (nm) in Co2(DPB) [38], Co2(DPA) [39], Co2(DPX) [40,41], and Co2(DPD)(2MeOH) [40,41].
Fig. 4
Fig. 4
EPR spectra of the μ-superoxo complex (~10−3 mol L−1) produced by adding iodine (~10−3 mol L−1) to an air-saturated PhCN solution and ESR simulation of (a) Co2(DPB), (b) Co2(DPA) and (c) Co2(DPX) in the presence of 1-tert-butyl-5-phenylimidazole (5 × 10⁻³ mol L−1) at 298 K [32].
Fig. 5
Fig. 5
Visible absorption spectra changes in the catalytic reduction of O2 (1.7 × 10⁻³ mol L−1) by Fe(C5H4Me)2 (2.0 × 10⁻² mol L−1) in the presence of HClO4 (2.0 × 10⁻² mol L−1) and 16 (2.0 × 10⁻⁵ mol L−1) in PhCN at 298 K; 1 (red solid line), 2 (green solid line), 3 (blue solid line), 4 (red broken line), 5 (green broken line) and 6 (blue broken line). Black: in the absence of cobalt complex.
Fig. 6
Fig. 6
Electrocatalytic reduction of O2 in 1 mol L−1 HClO4 at a rotating graphite disk electrode coated with (PMes2CO)Co2 1. (a) Values of the rotation rates of the electrode (w) are indicated on each curve. The disk potential was scanned at 5 mV s−1. (b) Levich plots of the plateau currents of (a) vs. (rotation rate)1/2. The dashed line refers to the theoretical curve expected for the diffusion-convection limited reduction of O2 by 2e. (c) Koutecky-Levich plots of the reciprocal plateau currents vs. (rotation rates)−1/2. Supporting electrolyte: 1 mol L−1 HClO4 saturated with air.
Fig. 7
Fig. 7
(a) X-ray structures of the fully reduced bimetallic heme a3/CuB center in CcO from bovine heart (FeII···CuI = 0.519 nm), (b) heme/Cu synthetic model for CcO (6LFeCu), (c) Cu-free version of synthetic model for CcO (6LFe).
Fig. 8
Fig. 8
(a) Levich plot from the plateau currents in plot of current vs. (rotation rate)1/2. (b) Koutecky-Levich plot from the plateau currents in Fig. 2 [(current)−1 vs. (rotation rate)1/2]. The dashed lines in (a) and (b) were obtained from the calculated diffusion-convection controlled currents for the reduction of O2 assuming the number of electrons as two and four.
Fig. 9
Fig. 9
Complexes used as catalysts for the solution four-electron four-proton reduction of O2 by ferrocene derivatives and the copper(I)-dioxygen derived complex intermediates known to form during the course of reaction. See text for discussions.
Fig. 10
Fig. 10
UV-vis spectral changes in four-electron reduction of O2 by Fc* (1.5 × 10⁻³ mol L−1) with [(tmpa)CuII(H2O)]2+ (9.0 × 10⁻⁵ mol L−1) in the presence of HClO4 in acetone at 298 K. The inset shows the changes in absorbance at 380 and 780 nm due to Fc*+ produced by stepwise addition of HClO4 (0.18 – 1.44 × 10⁻³ mol L−1) to an O2-saturated acetone solution ([O2] = 11 × 10−3 mol L−1) of Fc* and [(tmpa)CuII(H2O)]2+.
Fig. 11
Fig. 11
Depiction of the structure of the μ-η2:η2-peroxo dicopper(II) complex [CuII2(N3)(O2)]2+ (b) Formation of the η2:η2-peroxo complex (λmax = 490 nm) in the reaction of [CuI2(N3)]2+ (1.0 × 10⁻⁴ mol L−1) with O2 in the presence of Fc* (8.0 × 10⁻² mol L−1) in acetone at 193 K. The Inset shows the time profiles of the absorbance at 490 nm (black line) and 780 nm (red line) due to [CuII2(N3)(O2)]2+ and Fc*+, respectively. (c) UV/Vis spectral changes observed in the four-electron reduction of O2 (0.22 × 10⁻³ mol L−1) by Fc* (3.0 × 10⁻³ mol L−1) at 298 K and with TFA (1.0 × 10⁻² mol L−1) catalyzed by [CuII2(N3)(H2O)2]2+ (1.0 × 10⁻⁴ mol L−1).
Fig. 11
Fig. 11
Depiction of the structure of the μ-η2:η2-peroxo dicopper(II) complex [CuII2(N3)(O2)]2+ (b) Formation of the η2:η2-peroxo complex (λmax = 490 nm) in the reaction of [CuI2(N3)]2+ (1.0 × 10⁻⁴ mol L−1) with O2 in the presence of Fc* (8.0 × 10⁻² mol L−1) in acetone at 193 K. The Inset shows the time profiles of the absorbance at 490 nm (black line) and 780 nm (red line) due to [CuII2(N3)(O2)]2+ and Fc*+, respectively. (c) UV/Vis spectral changes observed in the four-electron reduction of O2 (0.22 × 10⁻³ mol L−1) by Fc* (3.0 × 10⁻³ mol L−1) at 298 K and with TFA (1.0 × 10⁻² mol L−1) catalyzed by [CuII2(N3)(H2O)2]2+ (1.0 × 10⁻⁴ mol L−1).
Fig. 12
Fig. 12
Cobalt porphyrins employed for electrocatalytic reduction of O2 to H2O2 [24].
Fig. 13
Fig. 13
(a) Electrocatalytic current at oxygen reduction. ([Co(DPP)] – –, [Co(OEP)] – · –, [Co(TPP)] - - -, [Co(TCPP)] —). (b) CV of [Co(TCPP)] at scan rate = 20 mV s−1 (with 3 × 10⁻³ mol L−1 H2O2 – –, with oxygen bubbling: ——). The measurements were performed in 1.0 × 10⁻¹ mol L−1 hydrosulphuric acid at 298 K. To prevent contamination of the coordinating ion or ligands, ultrapure water was used in the experiments.
Fig. 14
Fig. 14
TEM images of Ag or Ag-Pb alloy nanoparticles. (a) Ag nanoparticles, (b) Ag-Pb alloy (Ag:Pb = 9:1), (c) Ag-Pb alloy (7:3) and (d) Ag-Pb alloy (Ag:Pb = 6:4).
Fig. 15
Fig. 15
I-V and I-P curves of a one-compartment H2O2 fuel cell with Ag or Ag-Pb alloy cathode. (Au anode. 1.0 mol L−1 NaOH, 3.0 × 10⁻¹ mol L−1 H2O2. black: Ag, green: Ag:Pb = 6:4, red: Ag:Pb = 7:3 and blue: Ag:Pb = 9:1).
Fig. 16
Fig. 16
Chemical structures of porphyrin and phthalocyanine iron(III) complexes similar to active site structures of hydroperoxidases as candidates of cathodes for an H2O2 fuel cell. (a) [FeIII(Pc)Cl], (b) [FeIII(OEP)Cl] and (c) [FeIII(TPP)Cl].
Fig. 17
Fig. 17
Cyclic voltammograms of H2O2 on glassy carbon electrodes modified with FeIII complexes. (a) [FeIII(Pc)Cl], (b) [FeIII(OEP)Cl] and (c) [FeIII(TPP)Cl]. The measurements were performed in an acetate buffer solution (pH 4) containing 3.0 × 10⁻³ mol L−1.
Fig. 18
Fig. 18
IV and IP curves of a one-compartment H2O2 fuel cell with Ni anode and [FeIII(Pc)Cl] cathode. Performance tests were conducted in an acetate buffer containing 3.0 × 10⁻¹ mol L−1 H2O2. The pH of the solutions was fixed to 5 (a, blue), 4 (a, black) or 3 (b, red). Currents and powers were normalized by a geometric surface area of electrode.
Fig. 19
Fig. 19
(a) UV-vis absorption change of a benzonitrile solution of [FeIII(Pc)Cl] (4.0 × 10⁻⁵ mol L−1) by adding trifluoroacetic acid (2 – 16 × 10−3 mol L−1). (b) The Hill plot obtained from monitoring of the absorption changes at 520 nm.
Fig. 20
Fig. 20
Potential changes by repetitive measurements of H2O2 fuel cells with the Nafion® coated [FeIII(Pc)Cl] cathode (red) and without Nafion® coating (black). Potentials required to achieve the power density of 20 μA cm−2 were recorded.
Scheme 1
Scheme 1
Scheme 2
Scheme 2
Scheme 3
Scheme 3
Scheme 4
Scheme 4
Scheme 5
Scheme 5
Scheme 6
Scheme 6
Scheme 7
Scheme 7
Scheme 8
Scheme 8
Scheme 9
Scheme 9
Scheme 10
Scheme 10
Chart 1
Chart 1
Structures of biscobalt porphyrin-corrole complexes.

References

    1. Seinfeld JH. AIChE J. 2011;57:3259.
    1. Royer DL, Berner RA, Park J. Nature. 2007;446:530. - PubMed
    1. Lewis NS, Nocera DG. Proc Natl Acad Sci USA. 2006;103:15729. - PMC - PubMed
    1. Nocera DG. Chem Soc Rev. 2009;38:13. - PubMed
    1. Gray HB. Nat Chem. 2009;1:7. - PubMed

LinkOut - more resources