Comparative Study
. 2013;8(2):e54445.
doi: 10.1371/journal.pone.0054445. Epub 2013 Feb 14.

Latitudinal variations in seasonal activity of influenza and respiratory syncytial virus (RSV): a global comparative review

Affiliations
Comparative Study

Latitudinal variations in seasonal activity of influenza and respiratory syncytial virus (RSV): a global comparative review

Kimberly Bloom-Feshbach et al. PLoS One. 2013.

Abstract

Background: There is limited information on influenza and respiratory syncytial virus (RSV) seasonal patterns in tropical areas, although there is renewed interest in understanding the seasonal drivers of respiratory viruses.

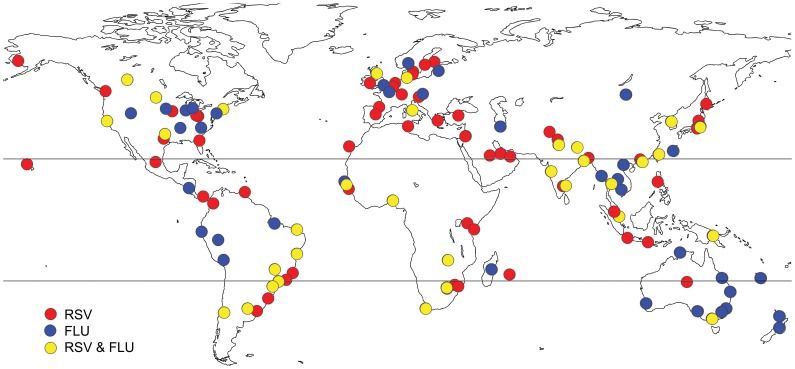
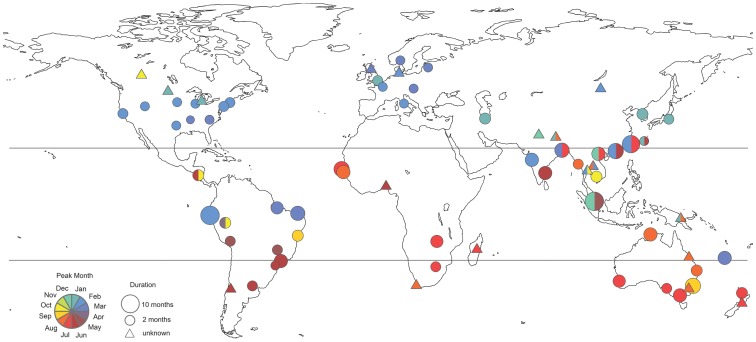
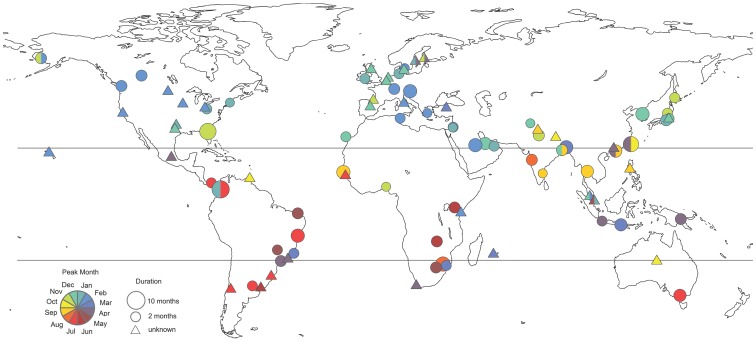
Methods: We review geographic variations in seasonality of laboratory-confirmed influenza and RSV epidemics in 137 global locations based on literature review and electronic sources. We assessed peak timing and epidemic duration and explored their association with geography and study settings. We fitted time series model to weekly national data available from the WHO influenza surveillance system (FluNet) to further characterize seasonal parameters.

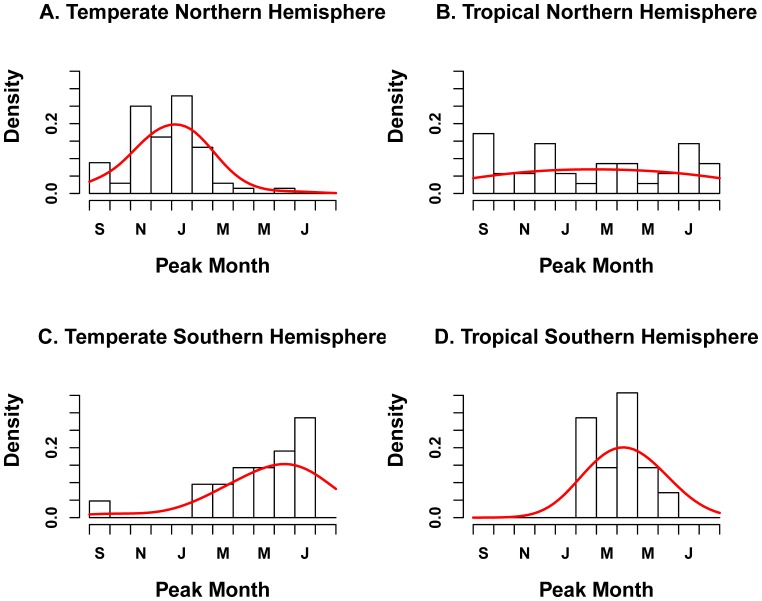
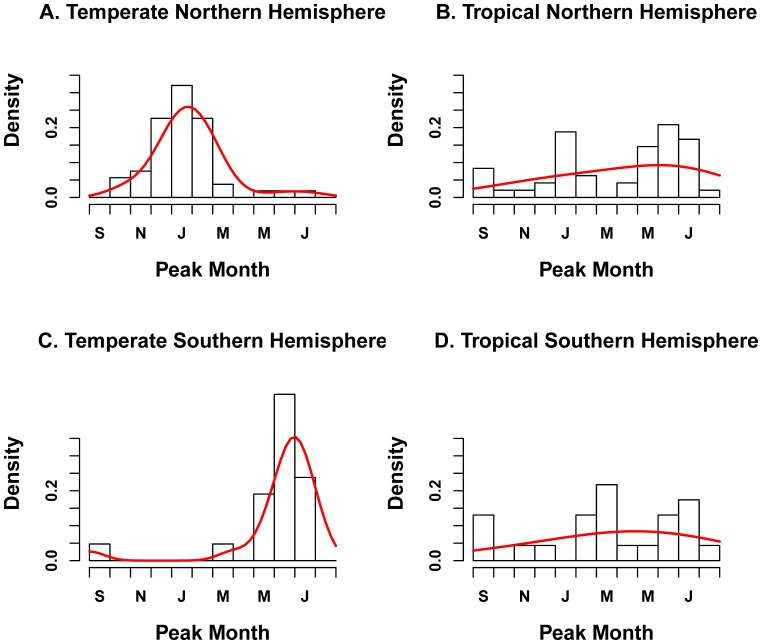
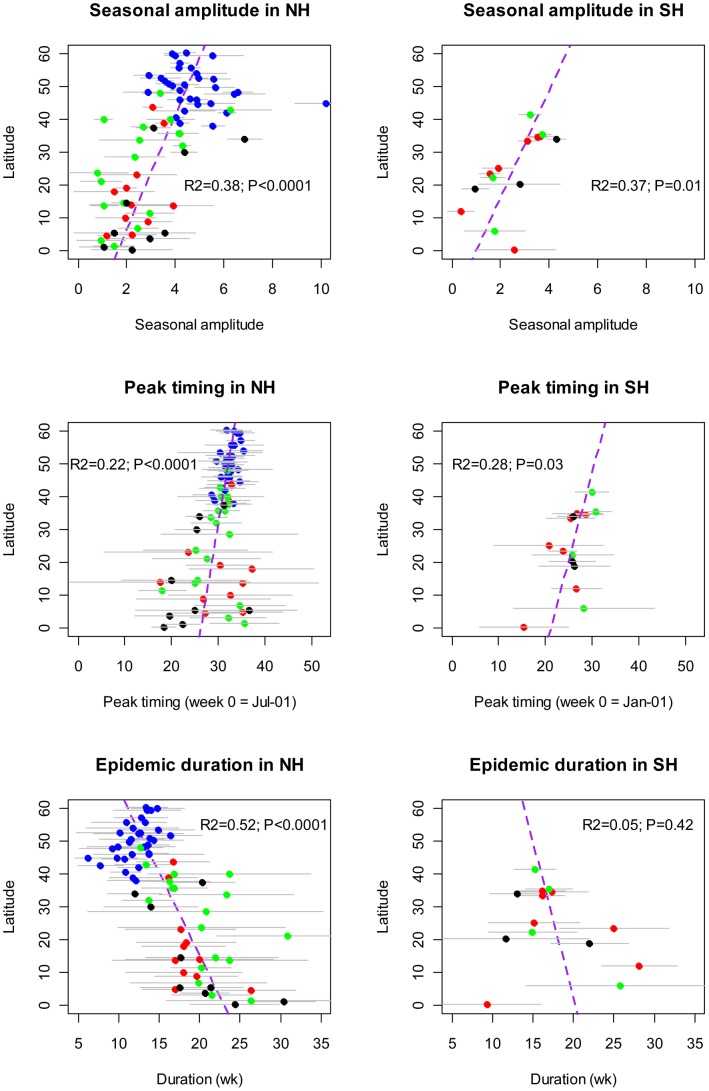
Results: Influenza and RSV activity consistently peaked during winter months in temperate locales, while there was greater diversity in the tropics. Several temperate locations experienced semi-annual influenza activity with peaks occurring in winter and summer. Semi-annual activity was relatively common in tropical areas of Southeast Asia for both viruses. Biennial cycles of RSV activity were identified in Northern Europe. Both viruses exhibited weak latitudinal gradients in the timing of epidemics by hemisphere, with peak timing occurring later in the calendar year with increasing latitude (P<0.03). Time series model applied to influenza data from 85 countries confirmed the presence of latitudinal gradients in timing, duration, seasonal amplitude, and between-year variability of epidemics. Overall, 80% of tropical locations experienced distinct RSV seasons lasting 6 months or less, while the percentage was 50% for influenza.

Conclusion: Our review combining literature and electronic data sources suggests that a large fraction of tropical locations experience focused seasons of respiratory virus activity in individual years. Information on seasonal patterns remains limited in large undersampled regions, included Africa and Central America. Future studies should attempt to link the observed latitudinal gradients in seasonality of viral epidemics with climatic and population factors, and explore regional differences in disease transmission dynamics and attack rates.


Conflict of interest statement

Competing Interests: Cécile Viboud is a PLOS ONE Editorial Board member. This does not alter the authors' adherence to all the PLOS ONE policies on sharing data and materials.

Figures

Figure 1
Figure 1. Map of 137 studied locations, for which information was retrieved on the seasonality of influenza or RSV viral activity (blue dot = influenza study, red dot = RSV study, yellow dot = both influenza and RSV information were available from the same study).
Figure 2
Figure 2. Global map of influenza peak timing and epidemic duration (n = 77 locations).
Colors illustrate timing of peak influenza activity, based on the bottom left key, while size of the circles is proportional to epidemic duration. For independent observations for the same location, an average was taken. For studies that did not provide enough information to estimate duration, a triangle is shown. Circles filled out with more than one color represent locations experiencing semi-annual peaks of virus activity (methods).
Figure 3
Figure 3. Distribution of influenza peak month by geographic zone (n = 77 locations).
The black histogram represents observations while the red curve illustrates the fit of a Gaussian density kernel.
Figure 4
Figure 4. Global map of RSV peak timing and epidemic duration (n = 96 locations).
Colors illustrate timing of peak RSV activity, based on the bottom left key, while size of the circles is proportional to epidemic duration. Independent observations for the same location were averaged out. For studies that did not provide enough information to estimate duration, a triangle is shown. Circles filled out with more than one color represent locations experiencing semi-annual peaks of virus activity (methods).
Figure 5
Figure 5. Distribution of RSV peak month by geographic zone (n = 96 locations).
The black histogram represents observations while the red curve illustrates the fit of a Gaussian density kernel.
Figure 6
Figure 6. Latitudinal gradients in the seasonal amplitude, timing, and duration of influenza epidemics, based on time series modeling of weekly influenza virus surveillance data from 85 countries reporting to FluNet.
Analysis was limited to countries providing ≥30 viruses for ≥3 yrs. Different colors represent different continents (blue = Europe; red = America; green = Asia-Pacific; black = Africa). Horizontal grey bars represent estimation error (top panels) or between-year fluctuation in seasonal characteristics (bottom panels, ±2 standard deviations).

Similar articles

Cited by

References

    1. Dowell SF (2001) Seasonal variation in host susceptibility and cycles of certain infectious diseases. Emerg Infect Dis 7: 369–374. - PMC - PubMed
    1. Viboud C, Alonso WJ, Simonsen L (2006) Influenza in tropical regions. PLoS Med 3: e89. - PMC - PubMed
    1. Lofgren E, Fefferman NH, Naumov YN, Gorski J, Naumova EN (2007) Influenza seasonality: underlying causes and modeling theories. J Virol 81: 5429–5436. - PMC - PubMed
    1. Tamerius J, Nelson MI, Zhou SZ, Viboud C, Miller MA, et al. (2011) Global influenza seasonality: reconciling patterns across temperate and tropical regions. Environ Health Perspect 119: 439–445. - PMC - PubMed
    1. Weber MW, Mulholland EK, Greenwood BM (1998) Respiratory syncytial virus infection in tropical and developing countries. Trop Med Int Health 3: 268–280. - PubMed

Publication types

MeSH terms