. 2013;8(2):e55934.
doi: 10.1371/journal.pone.0055934. Epub 2013 Feb 13.

Curcumin down-regulates DNA methyltransferase 1 and plays an anti-leukemic role in acute myeloid leukemia

Affiliations

Curcumin down-regulates DNA methyltransferase 1 and plays an anti-leukemic role in acute myeloid leukemia

Jianhua Yu et al. PLoS One. 2013.

Abstract

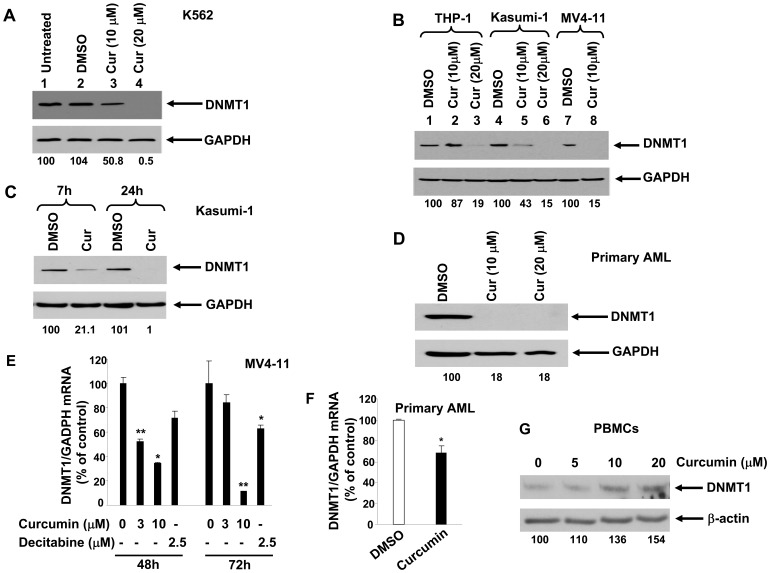
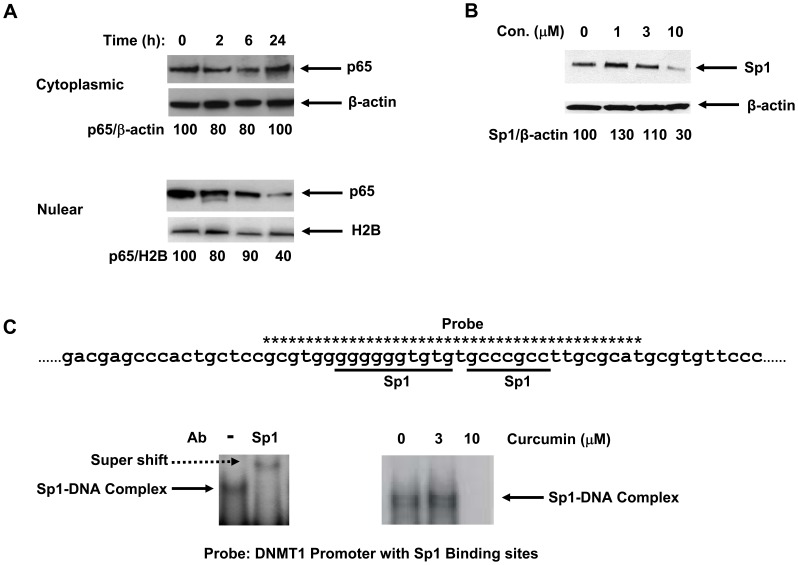
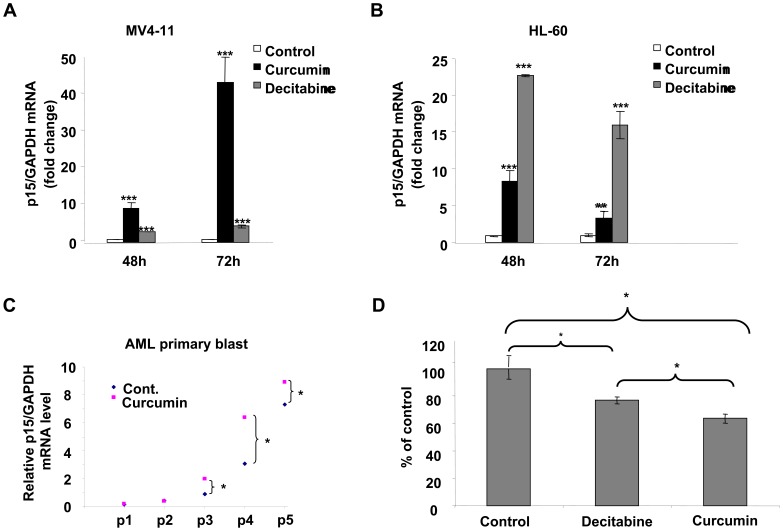
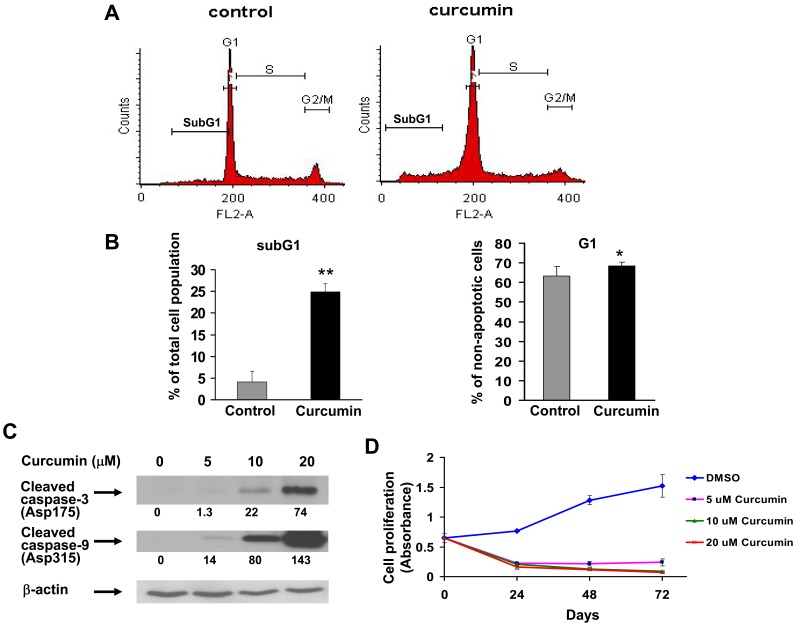
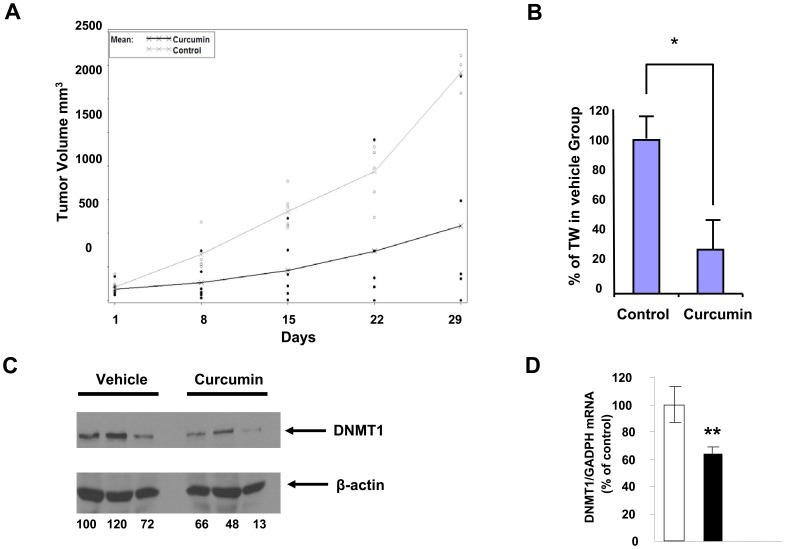
Bioactive components from dietary supplements such as curcumin may represent attractive agents for cancer prevention or treatment. DNA methylation plays a critical role in acute myeloid leukemia (AML) development, and presents an excellent target for treatment of this disease. However, it remains largely unknown how curcumin, a component of the popular Indian spice turmeric, plays a role in DNA hypomethylation to reactivate silenced tumor suppressor genes and to present a potential treatment option for AML. Here we show that curcumin down-regulates DNMT1 expression in AML cell lines, both in vitro and in vivo, and in primary AML cells ex vivo. Mechanistically, curcumin reduced the expression of positive regulators of DNMT1, p65 and Sp1, which correlated with a reduction in binding of these transcription factors to the DNMT1 promoter in AML cell lines. This curcumin-mediated down-regulation of DNMT1 expression was concomitant with p15(INK4B) tumor suppressor gene reactivation, hypomethylation of the p15(INK4B) promoter, G1 cell cycle arrest, and induction of tumor cell apoptosis in vitro. In mice implanted with the human AML MV4-11 cell line, administration of curcumin resulted in remarkable suppression of AML tumor growth. Collectively, our data indicate that curcumin shows promise as a potential treatment for AML, and our findings provide a basis for future studies to test the clinical efficacy of curcumin - whether used as a single agent or as an adjuvant - for AML treatment.


Conflict of interest statement

Competing Interests: The authors have declared that no competing interests exist.

Figures

Figure 1
Figure 1. Curcumin down-regulates DNMT1 mRNA and protein expression in myeloid leukemia cells in vitro and in vivo.
(A–D) DNMT1 and GAPDH antibodies were used for immunoblotting of total cell lysates from K562 (A), THP-1 (B), Kasumi-1 (B and C), and MV4–11 cells (B), or primary AML cells (D). These cells were either left untreated, treated with vehicle (DMSO), or treated with 10 µM curcumin (“Cur”) or 20 µM curcumin. Treatment lasted for 24 h (A, B), 7 and 24 h (C), or 72 h (D). Data shown in (A–D) are from one representative experiment of three total experiments, each with similar data. Numbers beneath each lane represent densitometric quantification of DNMT1, normalized to GAPDH. Values, depicted as percent change, were calculated as change relative to incubation with carrier control. (E, F) MV4–11 cells (E) or primary AML cells (F) were incubated with carrier containing either curcumin (curcumin was used at the concentrations indicated for MV4–11 cells, and 10 µM for primary cells) or decitabine (2.5 µM; positive control). DNMT1 transcript was assessed by RT PCR, and normalized to GAPDH internal control. *, p<0.05; **, p<0.01. (G) Peripheral blood mononuclear cells (PBMCs) were treated with the indicated concentrations of curcumin for 24 h. Total cell lysates were then used for immunoblot assay to detect DNMT1 and β-actin. Results from one of three donors with similar data are shown. Numbers beneath each lane represent densitometric quantification of DNMT1, normalized to β-actin.
Figure 2
Figure 2. Curcumin inhibits p65 and Sp1 protein expression and the association of Sp1 with the DNMT1 promoter.
(A) After MV4–11 cells were treated with curcumin (10 µM) for the indicated periods of time, cytoplasmic and nuclear extracts were analyzed for p65 protein expression via immunoblotting. Numbers beneath each lane represent densitometric quantification of p65 protein expression, following normalization to β-actin (cytoplasmic) or H2B (nuclear) expression. (B) Whole cell lysates were prepared from MV4–11 cells incubated for 24 h with carrier alone or carrier containing curcumin (concentrations as indicated). Sp1 protein expression was assessed via immunoblotting, quantified via densitometry, and normalized to β-actin loading control. Data shown in (A) and (B) are from one representative experiment of three total experiments, each with similar data. (C) A 32P-labeled probe, containing two Sp1 binding sites on the DNMT1 promoter (top panel) and an Sp1 antibody were used to perform EMSA assays using nuclear extracts from MV4–11 cells, either before treatment (bottom, left panel) or following incubation for 72 h or 48 h (not shown) with carrier alone or carrier containing the indicated concentration of curcumin (bottom, right panel).
Figure 3
Figure 3. Curcumin reactivates expression of p15INK4B and causes DNA hypomethylation of its promoter in AML cells.
(A, B) MV4–11 (A) or HL-60 (B) cells were treated with carrier (control), 10 µM curcumin, or 2.5 µM decitabine for the indicated periods of time. Expression of p15INK4B mRNA was then measured by quantitative real-time RT-PCR, and normalized to GAPDH internal control. (C) Primary leukemia cells from five patients with AML were incubated with carrier alone (control) or 10 µM curcumin for 48 h. Expression of p15INK4B mRNA was then measured by quantitative real-time RT-PCR, normalized to GAPDH internal control, and presented as relative levels. (D) MV4–11 cells were treated with carrier (control), 2.5 µM decitabine, or 10 µM curcumin for 48 h. DNA Methylation of the p15INK4B promoter was measured using a tandem LC-MS/MS method (as indicated in Materials and Methods), and is depicted relative to promoter methylation following treatment with carrier alone. *, p<0.05; **, p<0.01; ***, p<0.001.
Figure 4
Figure 4. Curcumin increases the proportion of cells in SubG1 and G1 phases of the cell cycle, induces caspase cleavage, and inhibits AML cell growth in vitro.
(A, B) MV4–11 cells were placed in serum-free medium for 48 h to synchronize cell cycle. Cells were then treated with carrier (control) or curcumin (10 µM) for 48 h, and cell cycle distribution was determined by flow cytometry. The percentages of cells in SubG1, G1, S, G2/M phases of the cell cycle were calculated for each treatment condition. Gating for each phase was performed as shown in histograms from a representative experiment in (A). Average percentages of cells in subG1 and G1 (after excluding subG1) from three independent experiments are summarized in (B). (C) MV4–11 cells were treated with curcumin for time periods as indicated. Total cell lysates were used for immunoblot assay with an antibody against cleaved caspase-3, cleaved caspase-9, or β-actin (for normalization). Results from one of three experiments with similar data are shown. Numbers beneath each lane represent densitometric quantification of cleaved caspase-3 or -9, normalized to β-actin. D) MV4–11 cells were treated with carrier alone (DMSO) or carrier containing curcumin at the indicated concentrations. After 24 h, 48 h, or 72 h, proliferation was assessed using CellTiter 96 Aqueous One Solution Reagent, and is presented here as absorbance measured by a spectrophotometer. *, p<0.05, **, p<0.01.
Figure 5
Figure 5. The anti-tumor effect of curcumin on MV4–11 tumor cells engrafted in nude mice.
(A–D) MV4–11 cells were engrafted in nu/nu mice. Mice were then treated daily (5 days/week), with IP doses of either 100 mg/kg curcumin formulated in vehicle (DMSO, ethanol and PBS) or formulation vehicle alone (6 mice per group). (A, B) Tumor sizes were measured (as indicated in Materials and Methods) and recorded on days 1, 8, 15, 22 and 29. (A) Tumor growth in each mouse as it occurred over time is depicted here as individual dots (empty circles represent individual mice treated with carrier control, and solid dots represent individual curcumin-treated mice). Trend lines represent mean tumor size of all mice from the control group (grey) or the curcumin-treated group (black). (B) The mice described above were sacrificed on day 29 to isolate tumors. Tumors were weighed, and the average percent reduction in tumor weight observed in the curcumin-treated group was calculated relative to the average tumor weight of the mice from the vehicle control group. *, p<0.05. (C, D) MV4–11-engrafted tumor tissues from the mice described above were excised 24 h after administration of the last dose of either curcumin or vehicle alone to measure DNMT1 protein expression. DNMT1 protein was measured via immunoblotting (C). Data for three individual representative mice from each treatment group are shown. Numbers beneath each lane represent quantification of DNMT1 by densitometry, normalized to β-actin. (D) DNMT1 mRNA expression was assessed via real-time RT-PCR and normalized to GAPDH internal control. Values depicted as the percent change were calculated as the change relative to treatment with carrier control. **, p<0.01.

References

    1. Baylin SB (2005) DNA methylation and gene silencing in cancer. Nat Clin Pract Oncol 2 Suppl 1S4–11. - PubMed
    1. Jones PA, Baylin SB (2002) The fundamental role of epigenetic events in cancer. Nat Rev Genet 3: 415–428. - PubMed
    1. Issa JP (2007) DNA methylation as a therapeutic target in cancer. Clin Cancer Res 13: 1634–1637. - PubMed
    1. Yoo CB, Jones PA (2006) Epigenetic therapy of cancer: past, present and future. Nat Rev Drug Discov 5: 37–50. - PubMed
    1. Blum W, Marcucci G (2005) Targeting epigenetic changes in acute myeloid leukemia. Clin Adv Hematol Oncol 3: 855–865, 882. - PubMed

Publication types

MeSH terms