. 2013 Sep:247:143-57.
doi: 10.1016/j.expneurol.2013.02.012. Epub 2013 Mar 1.

Comparison of sensory neuron growth cone and filopodial responses to structurally diverse aggrecan variants, in vitro

Affiliations

Comparison of sensory neuron growth cone and filopodial responses to structurally diverse aggrecan variants, in vitro

Justin A Beller et al. Exp Neurol. 2013 Sep.

Abstract

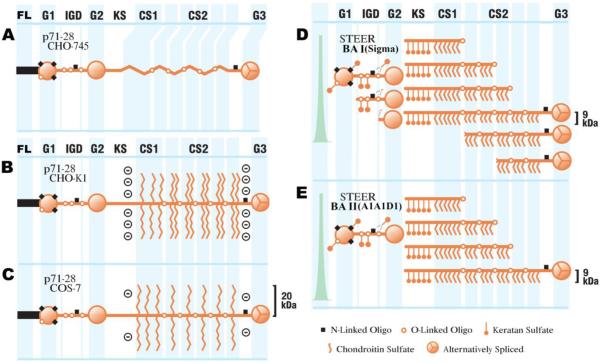
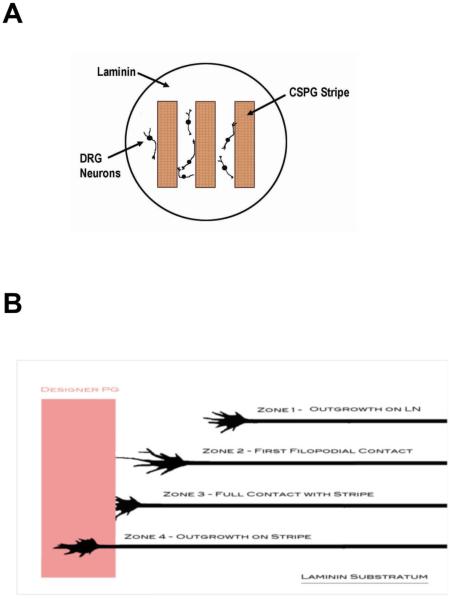
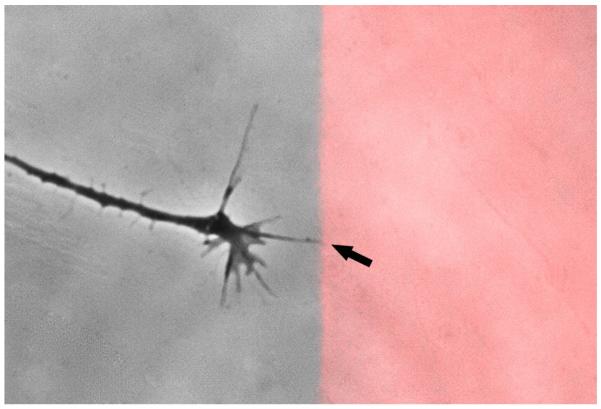
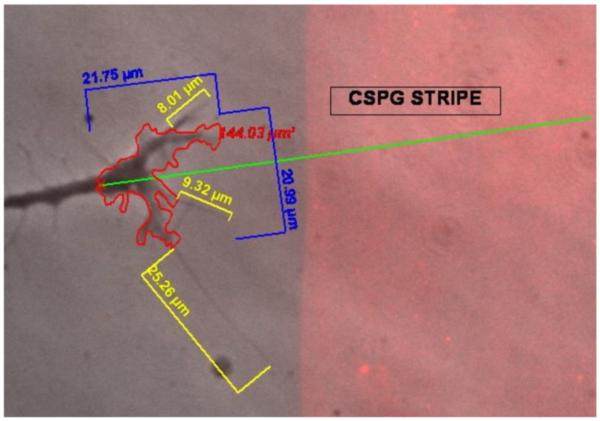
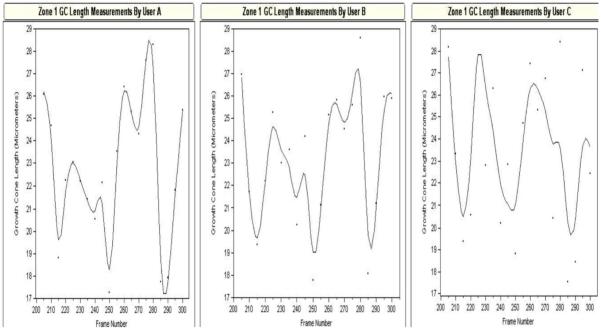
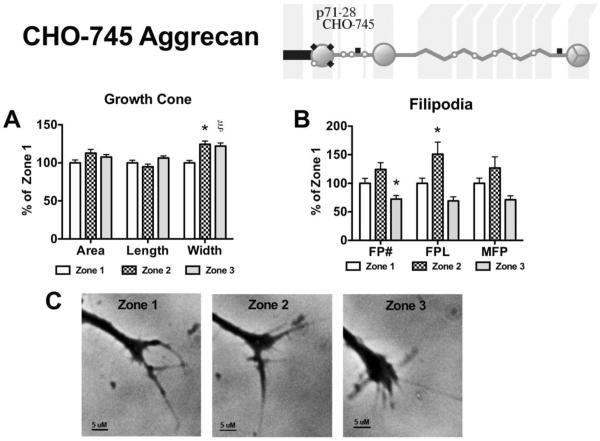
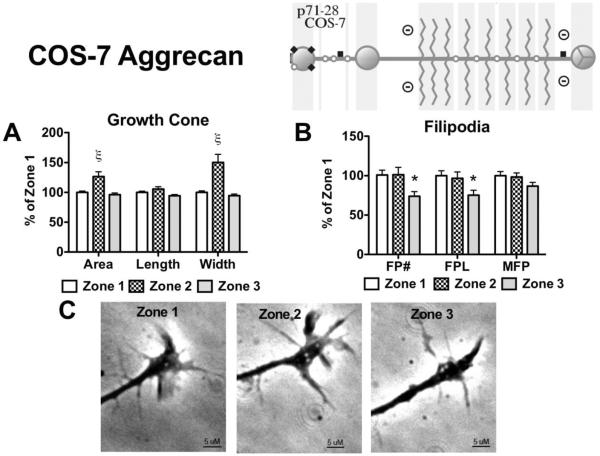
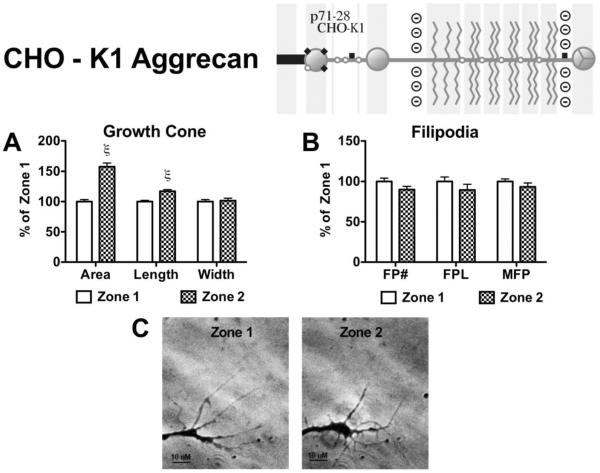
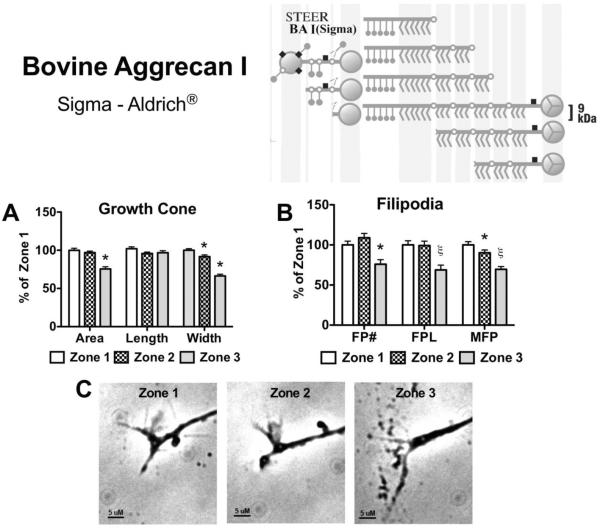
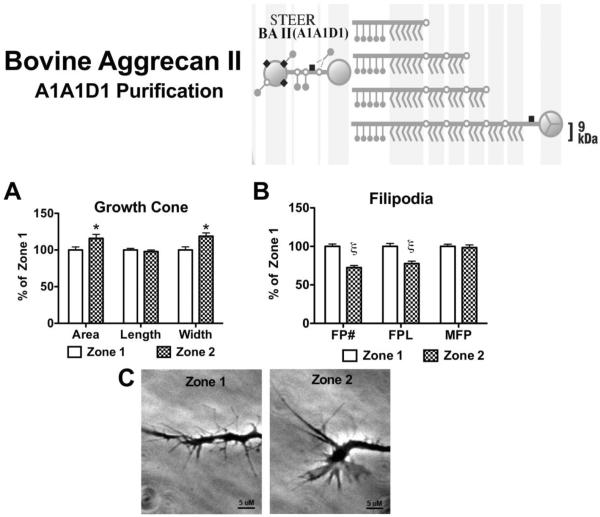
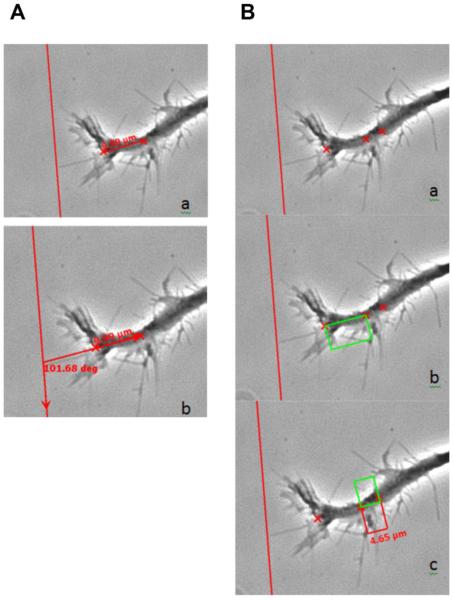
Following spinal cord injury, a regenerating neurite encounters a glial scar enriched in chondroitin sulfate proteoglycans (CSPGs), which presents a major barrier. There are two points at which a neurite makes contact with glial scar CSPGs: initially, filopodia surrounding the growth cone extend and make contact with CSPGs, then the peripheral domain of the entire growth cone makes CSPG contact. Aggrecan is a CSPG commonly used to model the effect CSPGs have on elongating or regenerating neurites. In this study, we investigated filopodia and growth cone responses to contact with structurally diverse aggrecan variants using the common stripe assay. Using time-lapse imaging with 15-s intervals, we measured growth cone area, growth cone width, growth cone length, filopodia number, total filopodia length, and the length of the longest filopodia following contact with aggrecan. Responses were measured after both filopodia and growth cone contact with five different preparations of aggrecan: two forms of aggrecan derived from bovine articular cartilage (purified and prepared using different techniques), recombinant aggrecan lacking chondroitin sulfate side chains (produced in CHO-745 cells) and two additional recombinant aggrecan preparations with varying lengths of chondroitin sulfate side chains (produced in CHO-K1 and COS-7 cells). Responses in filopodia and growth cone behavior differed between the structurally diverse aggrecan variants. Mutant CHO-745 aggrecan (lacking chondroitin sulfate chains) permitted extensive growth across the PG stripe. Filopodia contact with the CHO-745 aggrecan caused a significant increase in growth cone width and filopodia length (112.7% ± 4.9 and 150.9% ± 7.2 respectively, p<0.05), and subsequently upon growth cone contact, growth cone width remained elevated along with a reduction in filopodia number (121.9% ± 4.2; 72.39% ± 6.4, p<0.05). COS-7 derived aggrecan inhibited neurite outgrowth following growth cone contact. Filopodia contact produced an increase in growth cone area and width (126.5% ± 8.1; 150.3% ± 13.31, p<0.001), and while these parameters returned to baseline upon growth cone contact, a reduction in filopodia number and length was observed (73.94% ± 5.8, 75.3% ± 6.2, p<0.05). CHO-K1 derived aggrecan inhibited neurite outgrowth following filopodia contact, and caused an increase in growth cone area and length (157.6% ± 6.2; 117.0% ± 2.8, p<0.001). Interestingly, the two bovine articular cartilage aggrecan preparations differed in their effects on neurite outgrowth. The proprietary aggrecan (BA I, Sigma-Aldrich) inhibited neurites at the point of growth cone contact, while our chemically purified aggrecan (BA II) inhibited neurite outgrowth at the point of filopodia contact. BA I caused a reduction in growth cone width following filopodia contact (91.7% ± 2.5, p<0.05). Upon growth cone contact, there was a further reduction in growth cone width and area (66.4% ± 2.2; 75.6% ± 2.9; p<0.05), as well as reductions in filopodia number, total length, and max length (75.9% ± 5.7, p<0.05; 68.8% ± 6.0; 69.6% ± 3.5, p<0.001). Upon filopodia contact, BA II caused a significant increase in growth cone area, and reductions in filopodia number and total filopodia length (115.9% ± 5.4, p<0.05; 72.5% ± 2.7; 77.7% ± 3.2, p<0.001). In addition, filopodia contact with BA I caused a significant reduction in growth cone velocity (38.6 nm/s ± 1.3 before contact, 17.1 nm/s ± 3.6 after contact). These data showed that neuron morphology and behavior are differentially dependent upon aggrecan structure. Furthermore, the behavioral changes associated with the approaching growth cone may be predictive of inhibition or growth.

Keywords: BA; Bovine (steer) articular cartilage aggrecan; CHO-K1; COS7; CSPG; Cell culture; Chinese hamster ovary K1 (cell line); Chondroitin sulfate proteoglycan; Dorsal root ganglia neurons; Extracellular matrix (ECM); Neuronal growth cones; Regeneration; Simian kidney cell line; Velocity.


Figures

Figure 1
Figure 1. Structurally diverse aggrecan variants
Full-length aggrecan molecules contain 3 globular domains (G1, G2 and G3) connected by an interglobular domain (IGD; between G1 and G2) and a highly substituted stretch of amino acids, consisting of a domain of keratan sulfate substitution (KS) and two chondroitin sulfate substitution domains (CS1 and CS2) lying in between the G2 and G3 domain. In addition, the three recombinant aggrecan variants used in this study (CHO-745, CHO-K1, and COS-7) contain a FLAG peptide (FL). The appreciable differences in composition and content of the structurally diverse aggrecan variants are displayed. (A) CHO-745 aggrecan, (B) CHO-K1 aggrecan, (C) COS-7 aggrecan, (D) DEAE-purified steer bovine articular cartilage (BA I; Sigma), and (E) A1A1D1-purified steer bovine articular cartilage aggrecan (BA II). It is important to note the difference in fragmentation between BA I and BA II (D and E), as the A1A1D1-purified aggrecan contains only full-length protein or G1-containing fragments. For each of these variants the estimated chondroitin sulfate chain length is displayed in kDa. In addition, the degree of keratan sulfate and N-linked oligosaccharide substitution is also illustrated.
Figure 2
Figure 2. A schematic diagram of the tissue culture paradigm for testing dorsal root ganglion (DRG) neuron responses to substratum-bound aggrecan
(A) The tissue culture substratum was coated with poly-D-lysine (0.1 mg/ml) to bind protein. Aggrecan (150 μg/ml) was adsorbed in a stripe pattern. Laminin (25 μg/ml) was coated over the entire dish to create alternating lanes of laminin and aggrecan/laminin. (Adsorption of each aggrecan variant was done using the same technique and concentration, but in different cultures dishes for each; 3 replicates each). DRG neurons (E9–12) were seeded over the entire dish, and bound to laminin-only regions of the dish. (B) Time-lapse video-microscopy was used to observe outgrowth behaviors on laminin and as neurons encountered aggrecan/laminin-adsorbed regions. For analyses, examination points consisted of 1) outgrowth on laminin alone (Zone 1); 2) the point at which the first filopodia contacted the aggrecan-adsorbed area (Zone 2); 3) the transition zone when the growth cone was fully in contact with the aggrecan-adsorbed stripe (Zone 3); 4) outgrowth onto the aggrecan stripe (Zone 4; not used in analysis).
Figure 3
Figure 3. First filopodial contact
Growth cones elongate rapidly and efficiently on laminin alone (left side of image). As they elongate, they send out filopodia that sample the substratum, e.g. aggrecan labeled with Alexa 555 (right side of image; red). Changes in growth cones and filopodia can subsequently be observed following the initial filopodial contact with aggrecan (tip of arrow).
Figure 4
Figure 4. Annotation and growth cone analyses from time-lapse images
For each growth cone meeting the screening criteria, analyses were made of a wide variety of growth cone behaviors. Using specific tools provided by the Zeiss Axiovision system (Version 4.4), annotations were made on the images to perform measurements, e.g. growth cone width and length (blue), growth cone total area (red; excluding filopodia), filopodial length and number (yellow), and growth cone vector and angle of approach (green). A representative image with annotated measurements is shown here.
Figure 5
Figure 5. User consistency
The value of the data analyzing subtle and specific growth cone behaviors depends highly on consistency and accuracy by those doing the measurements. The left two panels represent data collected from two experimenters (Users A and B) who were trained, experienced at these types of measurements, and followed a conservative, detailed rubric for measurement, in this case, of growth cone length. The right panel (User C) represents data collected by a novice experimenter, who followed the rubric precisely. Although not as alike as A and B, user C clearly measures consistent trends, showing the value of the detailed rubric. Only data collected by trained, experienced experimenters (>20 traces) who precisely followed the rubric were used for this report.
Figure 6
Figure 6. Effects on growth cone and filopodia behavior following contact with CHO-745 derived aggrecan
Aggrecan (150 μg/mL) derived from CHO-745 cells was placed on a laminin-coated glass coverslip in a stripe to determine the effect contact with the aggrecan has on an elongating neurite. (Insert) CHO-745 derived aggrecan contains no chondroitin sulfate substitutions. (A) Effect of filopodial (Zone 2) and growth cone (Zone 3) contact on growth cone area, growth cone length, growth cone width, and (B) filopodia behavior; FP#, number of filopodia; FPL, total filopodial length; MFP, max filopodial length. (C) Representative phase-contrast micrographs of an individual growth cone in the 3 different zones, scale bar = 5 μM. *, p<0.05; ξ, p<0.001, n=3.
Figure 7
Figure 7. Effects on growth cone and filopodia behavior following contact with COS-7 derived aggrecan
Aggrecan (150 μg/mL) derived from COS-7 cells was placed on a laminin-coated glass coverslip in a stripe to determine the effect contact with the aggrecan has on an elongating neurite. (Insert) COS-7 derived aggrecan contains sparse chondroitin sulfate substitutions, with approximate chain length of 20 kDa. (A) Effect of filopodial (Zone 2) and growth cone (Zone 3) contact on growth cone area, growth cone length, growth cone width, and (B) filopodia behavior; FP#, number of filopodia; FPL, total filopodial length; MFP, max filopodial length. (C) Representative phase-contrast micrographs of an individual growth cone in the 3 different zones, scale bar = 5 μM. *, p<0.05; ξ , p<0.001, n=3.
Figure 8
Figure 8. Effects on growth cone and filopodia behavior following contact with CHO-K1 derived aggrecan
Aggrecan (150 μg/mL) derived from CHO-K1 cells was placed on a laminin-coated glass coverslip in a striped pattern to determine the effect contact with the aggrecan has on an elongating neurite. (Insert) CHO-K1 derived aggrecan contains tightly packed chondroitin sulfate substitutions, with approximate chain length of 20 kDa. (A) Effect of filopodial (Zone 2) contact on growth cone area, growth cone length, growth cone width, and (B) filopodia behavior; FP#, number of filopodia; FPL, total filopodial length; MFP, max filopodial length. (C) Representative phase-contrast micrographs of an individual growth cone in the 2 different zones, scale bar = 10 μM. *, p<0.05; ξ, p<0.001, n=3.
Figure 9
Figure 9. Effects on growth cone and filopodia behavior following contact with bovine articular cartilage derived aggrecan type I
Aggrecan (150 μg/mL) derived from bovine articular cartilage through DEAE chromatography (Sigma-Aldrich; BA I) was placed on a laminin-coated glass coverslip in a stripe to determine the effect contact with the aggrecan has on an elongating neurite. (Insert) BA I aggrecan contains very dense chondroitin sulfate substitutions with approximate chain length of 9 kDa, and fragments cleaved from both the N- and C-terminus. (A) Effect of filopodial (Zone 2) and growth cone (Zone 3) contact on growth cone area, growth cone length, growth cone width, and (B) filopodia behavior; FP#, number of filopodia; FPL, total filopodial length; MFP, max filopodial length. (C) Representative phase-contrast micrographs of an individual growth cone in the 3 different zones. Note beading and growth cone retraction in micrograph of Zone 3, scale bar = 5 μM. *, p<0.05; ξ, p<0.001, n=3.
Figure 10
Figure 10. Effects on growth cone and filopodia behavior following contact with bovine articular cartilage derived aggrecan type II
Aggrecan (150 μg/mL) derived from bovine articular cartilage through A1A1D1 purification was placed on a laminin-coated glass coverslip in a striped pattern to determine the effect contact with the aggrecan has on an elongating neurite. (Insert) BA II aggrecan contains very dense chondroitin sulfate substitutions with approximate chain length of 9 kDa. All aggrecan molecules in this preparation contain the G1 domain. BA II prevented neurite outgrowth into Zone 3. (A) Effect of filopodial (Zone 2) contact on growth cone area, growth cone length, growth cone width, and (B) filopodia behavior; FP#, number of filopodia; FPL, total filopodial length; MFP, max filopodial length. (C) Representative phase-contrast micrographs of an individual growth cone in the 2 different zones, scale bar = 5 μM. *, p<0.05; ξ, p<0.001, n=3.
Figure 11
Figure 11. Method of analyzing the approach angle and growth cone velocity
A) Phase contrast images of a growth cone approaching the CSPG-adsorbed stripe. The left-most X marks the end of the growth cone central domain and the right X marks the growth cone root (panel a; see Methods); b) When extended to the CSPG border (red vertical line), the growth cone angle of approach can be determined by comparing to a line parallel to the CSPG border. B) The left-most and middle X's (panels a and b) are the same as in Figure 8, in that they mark the end of the growth cone central domain and growth cone root, respectively. The right-most X is the position of the growth cone root of a frame that is ten frames prior to the one shown. That is, the change in growth cone root position over time approximates a velocity for the frame. b) A drawn parrallelogram assists in c) measuring distance (change in growth cone root position).
Figure 12
Figure 12. Growth cone velocity changes with single filopodial contact
(A) The velocity of an outgrowing neurites growth cone was measured for 20 frames prior to filopodia contact and 20 frames following filopodia contact. (A) Growth cone velocity versus time. The arrow indicates the point of first filopodial contact (n=8; time lapse series of one growth cone from each of 8 different animals). (B) Velocity before and after contact were averaged for direct comparison (n=8; * is p<0.001).

Similar articles

Cited by

References

    1. Asher RA, Fidler PS, Rogers JH, Fawcett JW. TGF-ß stimulates neurocan synthesis in cultured rat astrocytes. Soc for Neurosci Abst. 1998;24:56.
    1. Asher RA, Morgenstern DA, Fidler PS, Adcock KH, Oohira A, Braistead JE, Levine JM, Margolis RU, Rogers JH, Fawcett JW. Neurocan is upregulated in injured brain and in cytokine-treated astrocytes. J Neurosci. 2000;20:2427–2438. - PMC - PubMed
    1. Barbosa I, Garcia S, Barbier-Chassefiere V, Caruelle JP, Martelly I, Papy-Garcia D. Improved and simple micro assay for sulfated glycosaminoglycans quantification in biological extracts and its use in skin and muscle tissue studies. Glycobiology. 2003;13:647–653. - PubMed
    1. Barritt AW, Davies M, Marchand F, Hartley R, Grist J, Yip P, McMahon SB, Bradbury EJ. Chondroitinase ABC promotes sprouting of intact and injured spinal systems after spinal cord injury. J Neurosci. 2006;26:10856–10867. - PMC - PubMed
    1. Beller JA, Gurkoff GG, Berman RF, Lyeth BG. Pharmacological enhancement of glutamate transport reduces excitotoxicity in vitro. Restor Neurol Neurosci. 2011;29:331–346. - PubMed

Publication types