. 2013;9(2):e1002898.
doi: 10.1371/journal.pcbi.1002898. Epub 2013 Feb 14.

Transcranial electrical stimulation accelerates human sleep homeostasis

Affiliations

Transcranial electrical stimulation accelerates human sleep homeostasis

Davide Reato et al. PLoS Comput Biol. 2013.

Abstract

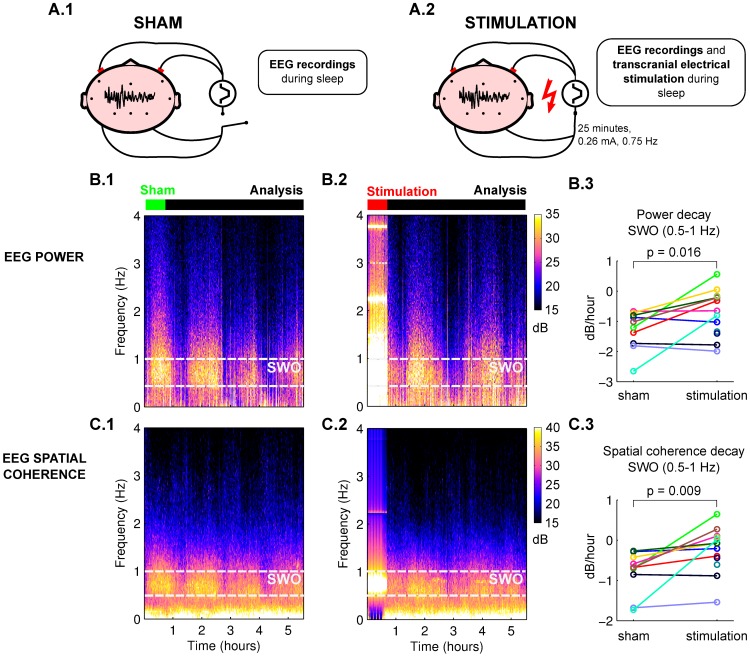
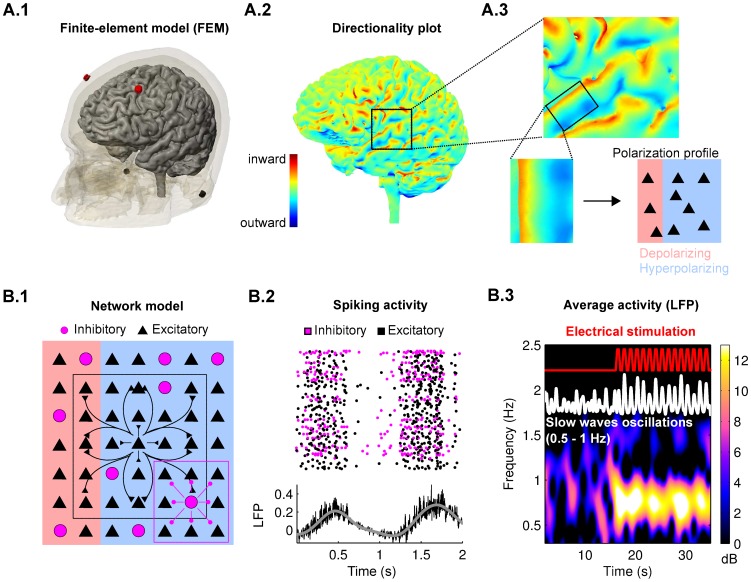
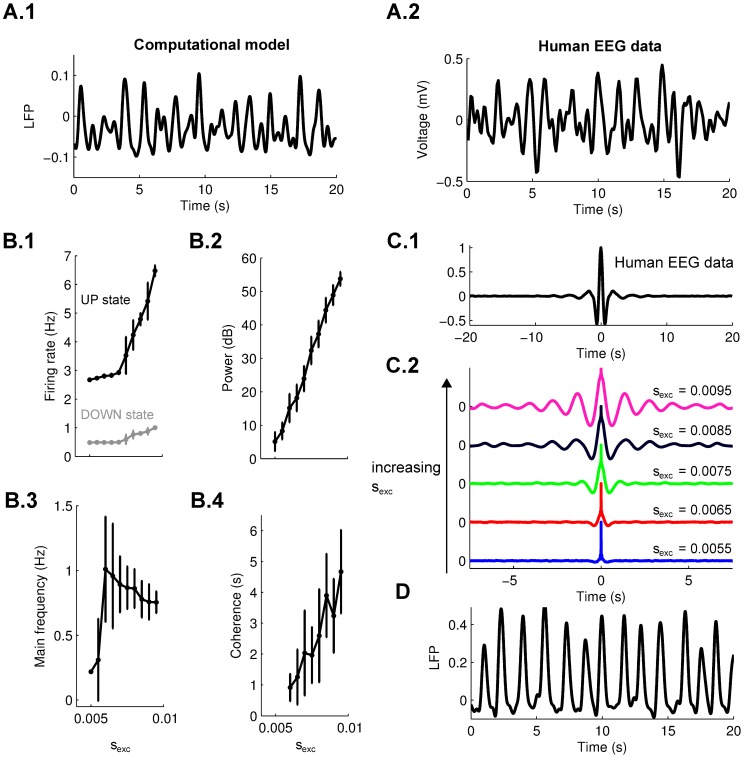
The sleeping brain exhibits characteristic slow-wave activity which decays over the course of the night. This decay is thought to result from homeostatic synaptic downscaling. Transcranial electrical stimulation can entrain slow-wave oscillations (SWO) in the human electro-encephalogram (EEG). A computational model of the underlying mechanism predicts that firing rates are predominantly increased during stimulation. Assuming that synaptic homeostasis is driven by average firing rates, we expected an acceleration of synaptic downscaling during stimulation, which is compensated by a reduced drive after stimulation. We show that 25 minutes of transcranial electrical stimulation, as predicted, reduced the decay of SWO in the remainder of the night. Anatomically accurate simulations of the field intensities on human cortex precisely matched the effect size in different EEG electrodes. Together these results suggest a mechanistic link between electrical stimulation and accelerated synaptic homeostasis in human sleep.


Conflict of interest statement

The authors have declared that no competing interests exist.

Figures

Figure 1
Figure 1. Transcranial electrical stimulation affects power and spatial coherence of human EEG during sleep.
EEG is recorded from 11 electrode locations, stimulation electrodes are placed bilaterally on the scalp. A.1: In the sham condition stimulation electrodes were placed but no current was applied. A.2: In the stimulation condition slow-oscillating (0.75 Hz) current is applied for 25 minutes at the beginning of the night. B.1–B.2: Spectrograms of power in sham and stimulation conditions during the night in the human EEG data (average across subjects, Pz electrode). C.1–C.2: Spectrograms of spatial coherence between Pz and other EEG electrodes. B.3: Decay rate of power in the SWO band during the analysis period (4.5 hours after the stimulation). Colors indicate subject. C.3: Decay rate for spatial coherence in the SWO band in the analysis period. Stimulation and sham condition differ significantly in decay rate for both power and coherence (paired shuffled statistics, N = 10 subjects).
Figure 2
Figure 2. Multi-scale model of transcranial electrical stimulation.
A.1: A Finite-Element Model (FEM) of tissue resistance was used to calculate electric field magnitude and direction at the cortical level in response to currents applied on the scalp. Electrodes were placed at the same locations as in the human sleep experiments (red = anodal = inward, blue = cathodal = outward). A.2: Applied electric fields show mixed polarities throughout cortex due to cortical folding (color indicates radial field component orthogonal to cortical surface). A.3: Cortical neurons in close proximity may be exposed to depolarizing (inward) and hyperpolarizing (outward) radial fields. B.1: The network model consists of excitatory and inhibitory neurons arranged in a 2D-lattice with long- and short-range synaptic connections respectively. Field magnitude and polarity of the stimulation applied follow the FEM computations and were applied to the network depending on the location within the lattice (applied polarity indicated with red/blue shading). B.2: Spiking activity of neurons in the network reproduces the typical UP and DOWN states of SWO. The LFP (black line) is determined as the average of the post-synaptic currents (gray line, LFP low-pass filtered, cut-off frequency 2.5 Hz). B.3: Example of network activity (LFP in white). Oscillation is in the range of human SWO (0.5–1 Hz). Spectrogram indicates power of this signal. Red curve indicates slow-oscillating ON/OFF stimulation (0.75 Hz) which is applied to the excitatory neurons in the network.
Figure 3
Figure 3. Entrainment of network oscillations to weak electric field stimulation and effects on homeostatic synaptic downscaling.
A.1: Change in average firing rate by constant current stimulation (DC) as a function of the stimulation intensity and the fraction of neurons polarized in either direction (depolarized and hyper-polarized). Firing rate increases or decreases depending on predominant polarity of field stimulation. A.2: Change in average firing rate during slow ON/OFF stimulation (0.75 Hz) as in A.1. Note the rectification of the effect of fields on firing rate, which now only increases for inward stimulation but does not decrease for outward currents. A.3: Entrainment of the network with 0.31 V/m monophasic ON/OFF stimulation for purely cathodal (blue) or purely anodal (red) field. Note that the ON period of stimulation aligns with the DOWN state for cathodal and with the UP state for anodal stimulation. A.4: Phase of network oscillations relative to the oscillating stimulus as a function of the same parameters as in A.1. B.1: Applying a firing-rate dependent synaptic update rule leads to a gradual decrease of average synaptic strength given the relatively high firing rate of the UP state. Electrical stimulation (red curve) accelerates this effect relative to sham (green curve). B.2–B.3: The immediate effect of decreased synaptic connections is a decrease in power and spatial coherence of network oscillations. In the stimulation condition, both power and spatial coherence after the stimulation are lower than in sham condition and they decay at a slower rate after stimulation. The results represent formula image 
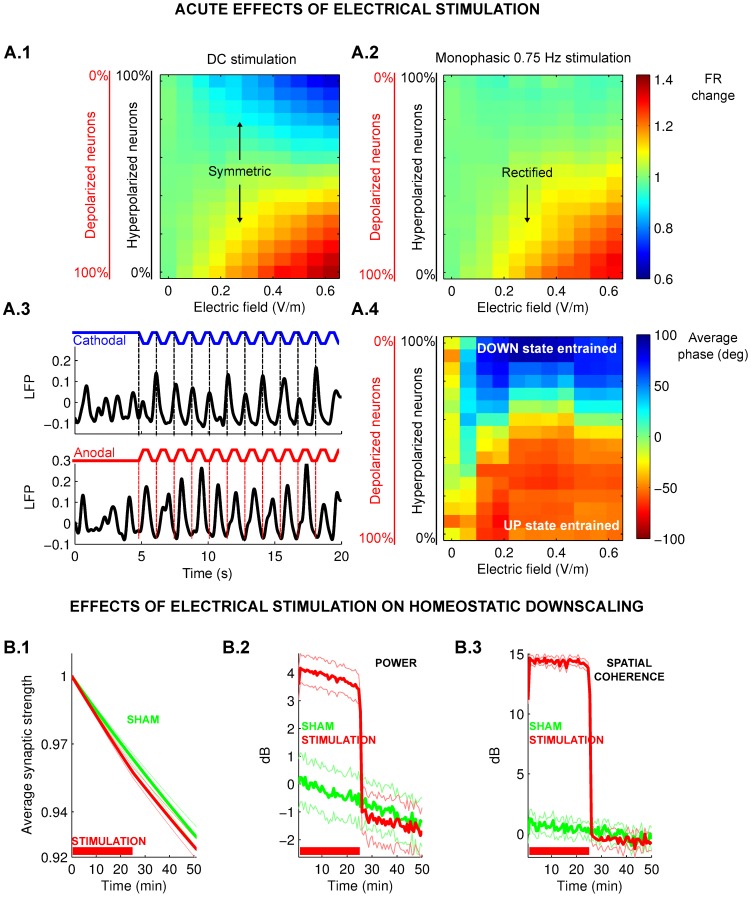
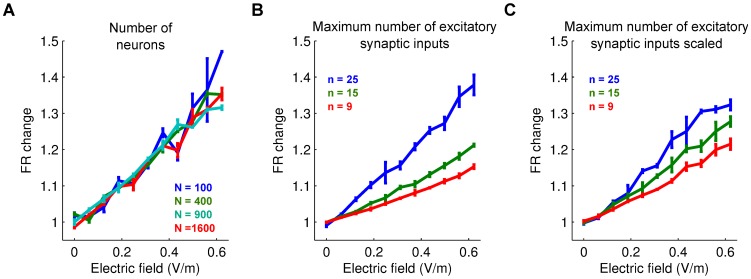
simulations with randomly chosen synaptic connections, bars indicate standard error of the mean.
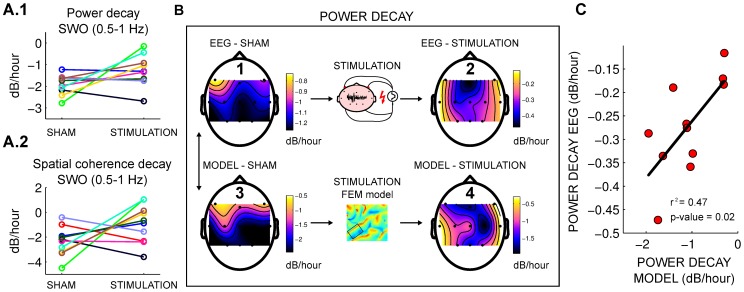
Figure 4
Figure 4. Multi-scale model predicted the after-effects of the stimulation and their variation across electrode locations.
A.1–A.2: Decay rate after the stimulation for sham and stimulation condition in the computational model for power and spatial coherence. Compare this to the measurements in the human EEG data in Figure 1.B.3–C.3. B: Spatial distribution of decay rates across the 11 scalp electrodes averaged across subjects. 1: for EEG power in sham condition, 2: for EEG power in stimulation condition, 3: Approximate fit of network model parameters to match human sham data for each electrode location, 4: Resulting decay rates for the location-matched network models with stimulation intensity and polarity determined from the FEM model in a 1 cm vicinity of each electrode location. C: Change in decay rate of power for stimulation condition. Each point represents one electrode with EEG data on vertical and multi-scale model on horizontal axis. EEG data significantly correlates with model prediction.
Figure 5
Figure 5. Slow waves features in the computational model.
A.1: Simulated local field potentials (LFP) in the computational model (low-pass filtered, cutoff frequency 2.5 Hz). A.2: Human EEG signal during slow-wave sleep (low-pass filtered, cutoff frequency 2.5 Hz). B: Dependence on excitatory connections strength of firing rate during the UP and DOWN states (B.1), power (B.2), main frequency (B.3) and coherence (B.4) of slow-wave oscillations (n = 5 simulations per data point, error bars indicate standard deviation). C.1: Example of auto-correlation of slow waves in the human EEG experiments (average of 5 subjects). C.2: Auto-correlation of simulated slow waves increasing the strength of excitatory connections. D: Example of simulated slow waves oscillations in the case of high synaptic connection strength (formula image).
Figure 6
Figure 6. Workflow to use the FEM analysis with the computational model.
A: Example of distribution of the normal component of the electric field under the electrodes considered in the FEM analysis (in this case Pz electrode). B: Radial field magnitudes in A were sorted and sampled in 30 location (3.12 percentile extremes were excluded). C: The sampled electric fields are then used for each column of neurons in the 2D lattice of the network model.
Figure 7
Figure 7. The effects of electric fields on firing rate depend on synaptic connectivity.
Normalized change in the average neuronal firing rate as a function of the number of neurons in the network model (A) or the numbers of pre-synaptic excitatory inputs (B). C: Same than in B but with constant total synaptic input. Effect of fields on firing rate depends on number of input synapses and not network size.

References

    1. Riedner BA, Vyazovskiy VV, Huber R, Massimini M, Esser S, et al. (2007) Sleep homeostasis and cortical synchronization: III. a high-density EEG study of sleep slow waves in humans. Sleep 30: 16431657. - PMC - PubMed
    1. Nir Y, Staba RJ, Andrillon T, Vyazovskiy VV, Cirelli C, et al. (2011) Regional slow waves and spindles in human sleep. Neuron 70: 153169. - PMC - PubMed
    1. Borbély AA, Baumann F, Brandeis D, Strauch I, Lehmann D (1981) Sleep deprivation: effect on sleep stages and EEG power density in man. Electroencephalography and Clinical Neurophysiology 51: 483495. - PubMed
    1. Liu Z, Faraguna U, Cirelli C, Tononi G, Gao X (2010) Direct evidence for wake-related increases and sleep-related decreases in synaptic strength in rodent cortex. The Journal of Neuroscience: The Official Journal of the Society for Neuroscience 30: 86718675. - PMC - PubMed
    1. Cirelli C (2009) The genetic and molecular regulation of sleep: from fruit flies to humans. Nature Reviews Neuroscience 10: 549560. - PMC - PubMed

Publication types