

Timing and distribution of protein ingestion during prolonged recovery from resistance exercise alters myofibrillar protein synthesis
- PMID: 23459753
- PMCID: PMC3650697
- DOI: 10.1113/jphysiol.2012.244897
Timing and distribution of protein ingestion during prolonged recovery from resistance exercise alters myofibrillar protein synthesis
Abstract
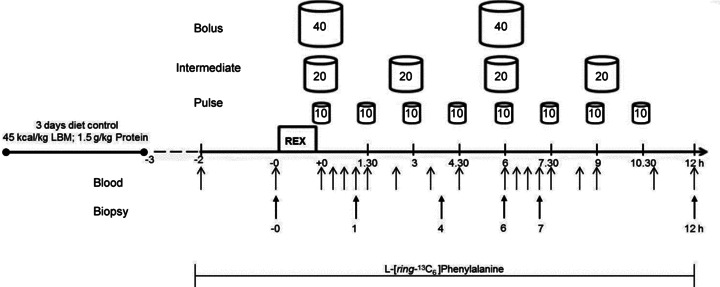
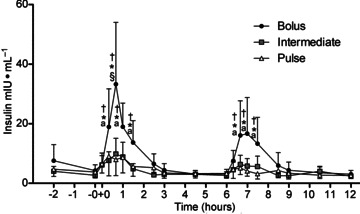
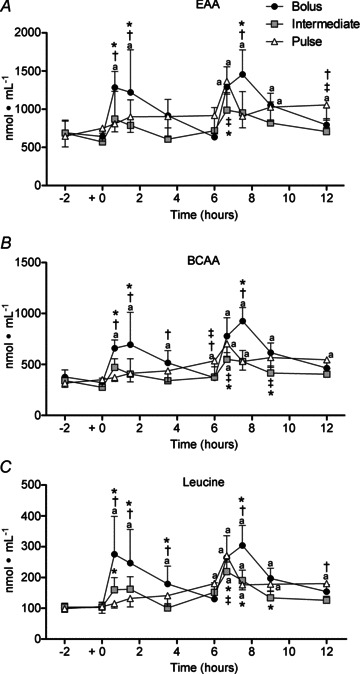
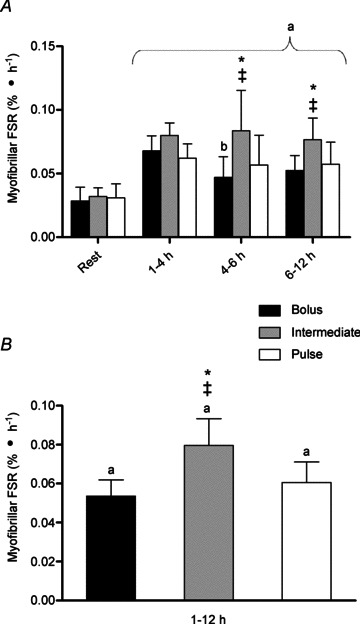
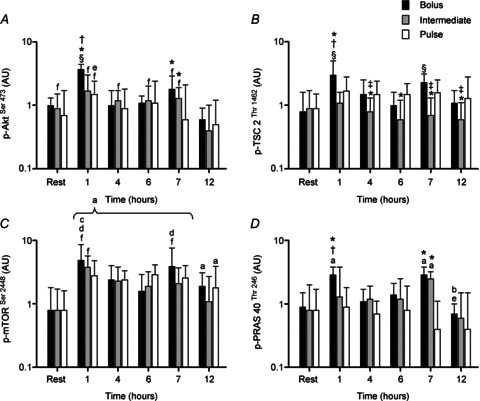
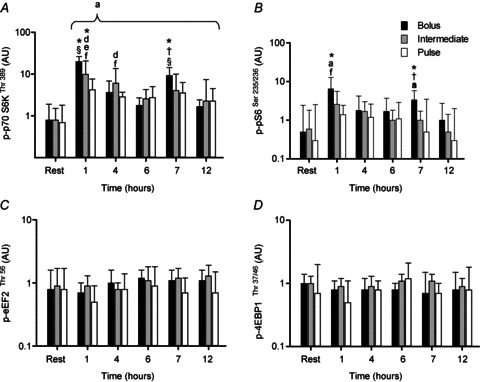
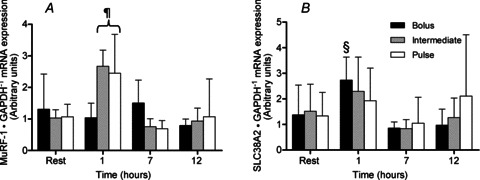
Quantity and timing of protein ingestion are major factors regulating myofibrillar protein synthesis (MPS). However, the effect of specific ingestion patterns on MPS throughout a 12 h period is unknown. We determined how different distributions of protein feeding during 12 h recovery after resistance exercise affects anabolic responses in skeletal muscle. Twenty-four healthy trained males were assigned to three groups (n = 8/group) and undertook a bout of resistance exercise followed by ingestion of 80 g of whey protein throughout 12 h recovery in one of the following protocols: 8 × 10 g every 1.5 h (PULSE); 4 × 20 g every 3 h (intermediate: INT); or 2 × 40 g every 6 h (BOLUS). Muscle biopsies were obtained at rest and after 1, 4, 6, 7 and 12 h post exercise. Resting and post-exercise MPS (l-[ring-(13)C6] phenylalanine), and muscle mRNA abundance and cell signalling were assessed. All ingestion protocols increased MPS above rest throughout 1-12 h recovery (88-148%, P < 0.02), but INT elicited greater MPS than PULSE and BOLUS (31-48%, P < 0.02). In general signalling showed a BOLUS>INT>PULSE hierarchy in magnitude of phosphorylation. MuRF-1 and SLC38A2 mRNA were differentially expressed with BOLUS. In conclusion, 20 g of whey protein consumed every 3 h was superior to either PULSE or BOLUS feeding patterns for stimulating MPS throughout the day. This study provides novel information on the effect of modulating the distribution of protein intake on anabolic responses in skeletal muscle and has the potential to maximize outcomes of resistance training for attaining peak muscle mass.
Figures
Comment in
-
Refining dietary protein recommendations for the athlete.J Physiol. 2013 Jun 15;591(12):2967-8. doi: 10.1113/jphysiol.2013.255927. J Physiol. 2013. PMID: 23774680 Free PMC article. No abstract available.
-
Pattern of protein ingestion to maximise muscle protein synthesis after resistance exercise.J Physiol. 2013 Jun 15;591(12):2969-70. doi: 10.1113/jphysiol.2013.256156. J Physiol. 2013. PMID: 23774681 Free PMC article. No abstract available.
References
-
- Atherton PJ, Etheridge T, Watt PW, Wilkinson D, Selby A, Rankin D, Smith K, Rennie MJ. Muscle full effect after oral protein: time-dependent concordance and discordance between human muscle protein synthesis and mTORC1 signaling. Am J Clin Nutr. 2010;92:1080–1088. - PubMed
-
- Baar K, Esser K. Phosphorylation of p70(S6k) correlates with increased skeletal muscle mass following resistance exercise. Am J Physiol Cell Physiol. 1999;276:C120–C127. - PubMed
-
- Biolo G, Maggi SP, Williams BD, Tipton KD, Wolfe RR. Increased rates of muscle protein turnover and amino acid transport after resistance exercise in humans. Am J Physiol Endocrinol Metab. 1995;268:E514–E520. - PubMed
-
- Biolo G, Tipton KD, Klein S, Wolfe RR. An abundant supply of amino acids enhances the metabolic effect of exercise on muscle protein. Am J Physiol Endocrinol Metab. 1997;273:E122–E129. - PubMed
Publication types
MeSH terms
Substances
LinkOut - more resources
Full Text Sources
Other Literature Sources