. 2013 Apr;116(4):869-80.
doi: 10.1213/ANE.0b013e3182860fc9. Epub 2013 Mar 4.

Ketamine enhances human neural stem cell proliferation and induces neuronal apoptosis via reactive oxygen species-mediated mitochondrial pathway

Affiliations

Ketamine enhances human neural stem cell proliferation and induces neuronal apoptosis via reactive oxygen species-mediated mitochondrial pathway

Xiaowen Bai et al. Anesth Analg. 2013 Apr.

Abstract

Background: Growing evidence indicates that ketamine causes neurotoxicity in a variety of developing animal models, leading to a serious concern regarding the safety of pediatric anesthesia. However, if and how ketamine induces human neural cell toxicity is unknown. Recapitulation of neurogenesis from human embryonic stem cells (hESCs) in vitro allows investigation of the toxic effects of ketamine on neural stem cells (NSCs) and developing neurons, which is impossible to perform in humans. In the present study, we assessed the influence of ketamine on the hESC-derived NSCs and neurons.

Methods: hESCs were directly differentiated into neurons via NSCs. NSCs and 2-week-old neurons were treated with varying doses of ketamine for different durations. NSC proliferation capacity was analyzed by Ki67 immunofluorescence staining and bromodeoxyuridine assay. Neuroapoptosis was analyzed by TUNEL staining and caspase 3 activity measurement. The mitochondria-related neuronal apoptosis pathway including mitochondrial membrane potential, cytochrome c distribution within cells, mitochondrial fission, and reactive oxygen species (ROS) production were also investigated.

Results: Ketamine (100 µM) increased NSC proliferation after 6-hour exposure. However, significant neuronal apoptosis was only observed after 24 hours of ketamine treatment. In addition, ketamine decreased mitochondrial membrane potential and increased cytochrome c release from mitochondria into cytosol. Ketamine also enhanced mitochondrial fission as well as ROS production compared with no-treatment control. Importantly, Trolox, a ROS scavenger, significantly attenuated the increase of ketamine-induced ROS production and neuronal apoptosis.

Conclusions: These data for the first time demonstrate that (1) ketamine increases NSC proliferation and causes neuronal apoptosis; (2) mitochondria are involved in ketamine-induced neuronal toxicity, which can be prevented by Trolox; and (3) the stem cell-associated neurogenesis system may provide a simple and promising in vitro model for rapidly screening anesthetic neurotoxicity and studying the underlying mechanisms as well as prevention strategies to avoid this toxic effect.


Figures
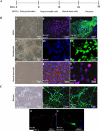
Figure 1
Figure 1
Differentiation of hESCs into neurons. A, Timeline for the generation of neurons from human embryonic stem cells (hESCs). hESCs were induced to differentiate into neurons in vitro via a four-step program that includes embryoid body formation, neural rosette cell differentiation, neural stem cell (NSC) expansion, and neuronal differentiation. B, Differentiation of hESCs into NSCs. (a to c) Characterization of hESCs. hESCs grew as uniform flat colonies on mouse embryonic fibroblasts (MEF) (a). hESCs expressed pluripotent stem cell markers Oct-4 (b, pink) and SSEA-4 (c, green). Blue are cell nuclei. (d and e) Characterization of rosette cells. Rosette cells were observed 15 days after the initiation of neural differentiation from hESCs (d). They expressed neuroepithelial cell marker PAX6 (e2, green) in the cell nuclei (e1, blue). (f to h) Characterization of NSCs. NSCs grew as a monolayer (f). They were positive for NSC-specific marker nestin (g, red) and proliferating marker Ki67 (h, red). Blue are cell nuclei. Scale bars are 50 μm in Figures a to d, and f; 20 μm in Figures e, g, and h. C, Characterization of differentiated neurons from hESCs. Two weeks after culturing in neuronal differentiation medium, NSCs demonstrated neuron-like morphology with a small round cell body extending long projections (a). Differentiated cells were positive for neuron-specific markers β-tubulin III (b, green) and MAP2 (c, green). In addition, these differentiated neurons expressed synapse-specific marker synapsin-1 (d, red) and postsynaptic marker Homer 1 (e, green). Scale bar=20 μm.
Figure 2
Figure 2
Short-term exposure of 100 μM ketamine enhances NSC proliferation but does not induce NSC death. A, Ketamine increases Ki67-positive NSCs. NSCs were treated with ketamine for 3 and 6 h. The expression of Ki67 (red), a proliferating cell marker, was analyzed using immunofluorescence staining. Blue are cell nuclei. B, Ketamine significantly increases Ki67-positive NSCs (*P<0.05) vs. 6 h no-treatment control, n=3). C, Ketamine increases NSC proliferation analyzed by bromodeoxyurindine incorporation. Ketamine significantly enhanced NSC proliferation after 6 h of exposure (*P<0.05 vs. 6 h no-treatment control,n=3). D, Ketamine does not cause NSC apoptosis analyzed by caspase 3 activity (n=7). The 95% confidence intervals for the difference (adjusted by Tukey's method) were (−0.012, 0.037) for 3 h-control vs. 3 h-ketamine, (−0.032, 0.017) for 6 h-control vs. 6 h-ketamine, and (−0.016, 0.033) for 24 h-control vs. 24 h-ketamine.
Figure 3
Figure 3. Ketamine causes abnormal cellular changes in ultrastructure
Representative electron microscope images of differentiated neurons treated with the indicated concentrations of ketamine for 24 h. Ketamine-treated neurons showed clear signs of the toxic effect on the cellular ultrastructure. Abnormal ultrastructure of neurons included mitochondrial fragmentation and many autophagosomes with or without being packed with dense amorphous material. In addition, Golgi structures in the 100 μM ketamine-treated cells were not observed. Red, blue, and green arrows indicate mitochondria, autophagosome, and Golgi, respectively. Scale bars=500 nm.
Figure 4
Figure 4. Ketamine increases cleaved caspase 3 activity and TUNEL-positive apoptotic cells
A, Measurement of caspase 3 activity in the lysate of neurons treated with or without 100 μM ketamine for 24 h. B, TUNEL staining used to identify DNA damage in cells after a 24-h exposure to 100 μM ketamine. TO-PRO®-3 was used to stain DNA (blue). Overlaid images demonstrate that most TUNEL signals were located in the condensed or fragmented nuclei in ketamine-treated cells. The representative fragmented nuclei are indicated using arrows. Scale bars are 20 μm. C, Quantification of the percentage of TUNEL-positive cells. Significant increases in caspase 3 activity and TUNEL-positive cells were observed in ketamine-treated culture compared with untreated controls (*P<0.05 vs. control, n=3).
Figure 5
Figure 5. Ketamine decreases mitochondrial membrane potential (ΔΨm) and increases cytochrome c release form mitochondria into cytosol
A, ΔΨm assay. Cells were loaded with mitochondrial probe TMRE and imaged with the confocol microscope. The fluorescent intensity of TMRE represents ΔΨm. The results show that 100 μM ketamine treatment for 24 h decreased ΔΨm (*P<0.05 vs. control, n=3). B, Colocalization of TMRE and mitochondria-targeted green fluorescence protein (GFP). Differentiated neurons labeled with CellLight™ mitochondria-GFP reagent expressed GFP. The GFP-positive cells were then loaded with TMRE. Overlaid image indicates the colocalization of TMRE and mitochondria-GFP fluorescent signals, suggesting GFP expression within mitochondria. C, Representative fluorescent images of the neurons transduced with CellLight™ mitochondria-GFP reagent. Blue are cell nuclei. Transduction efficiency was 40%. D, The distribution of cytochrome c in cells. Neurons labeled with CellLight™ mitochondria-GFP reagent expressed GFP in mitochondria. The distribution of cytotochrome c in cells was analyzed by immunufluorescence staining. Column 1 is the image of mitochondria (green); column 2 is the image of cytochrome c (red); column 3 is the merged image. The inset in the top corner of each image is the magnified box indicated by white arrows. The orange color in the merged images indicates the existence of cytochrome c inside the mitochondria and the red signals in the merged images indicate the existence of cytochrome c outside the mitochondria. Ketamine treatment (100 μM, 24 h) increased cytochrome c release from mitochondria into cytosol. The concentrated cytochrome c (red signals pointed by blue arrows) outside the mitochondria that does not overlap with GFP florescence is from nontransduced cells. Scale bar=10 μm.
Figure 6
Figure 6. Ketamine increases mitochondrial fission
A, Mitochondrial shape in the cells treated with or without 100 μM ketamine for 24 h. Differentiated neurons labeled with CellLight™ mitochondria-green fluorescence protein (GFP)reagent expressed GFP in the mitochondria. Mitochondria are elongated and interconnected in the control cells (a) while mitochondria are short and disconnected in the ketamine-treated culture (b). Figure A-c and d are the black and white images of Figure A-a and b, respectively. Scale bar=10 μm. B–C, Analysis of mitochondria shapes using Image J 1.41o software. The mitochondria in the ketamine-treated neurons had significantly lower values of both form factor and aspect ratio, suggesting that ketamine increases mitochondrial fission (*P<0.05 and **P<0.01 vs. control group).
Figure 7
Figure 7. ROS generated from mitochondria mediates ketamine-induced neurotoxicity
Neurons were treated with 100 μM ketamine in the presence or absence of Trolox (250 μM) for 24 h and then subjected to intracellular reactive oxygen species (ROS) measurement (A and B), mitochondrial ROS assay (C and D), and TUNEL staining (E and F). A, Fluorescence images of intracellular ROS production loaded with ROS probe CM-H2DCFDA. Green fluorescence representing intracellular ROS was recorded using the confocol microscope. B, Ketamine increases ROS production and Trolox, a ROS scavenger, attenuates ketamine-induced ROS production. **P<0.01 vs. control or ketamine + Trolox group, n=3. C, Fluorescence images of mitochondrial ROS in the culture loaded with MitoSOX™ Red. Red fluorescence indicates superoxide generation within the mitochondria. D, Ketamine induces the formation of mitochondrial superoxide and Trolox decreases mitochondrial ROS production caused by ketamine. *P<0.05 vs. control or ketamine + Trolox group, respectively. n=3. E, Fluorescence images of the cells following TUNEL staining. Blue are cell nuclei and red are the nuclei in the apoptotic cells. F, Trolox attenuates the increase of TUNEL-positive cells caused by ketamine treatment. *P<0.05 vs. control or ketamine + Trolox group, n=3.

References

    1. Chalon J, Tang CK, Ramanathan S, Eisner M, Katz R, Turndorf H. Exposure to halothane and enflurane affects learning function of murine progeny. Anesth Analg. 1981;60:794–7. - PubMed
    1. Jevtovic-Todorovic V, Hartman RE, Izumi Y, Benshoff ND, Dikranian K, Zorumski CF, Olney JW, Wozniak DF. Early exposure to common anesthetic agents causes widespread neurodegeneration in the developing rat brain and persistent learning deficits. J Neurosci. 2003;23:876–82. - PMC - PubMed
    1. Mazoit JX, Roulleau P, Baujard C. Isoflurane-induced neuroapoptosis in the neonatal rhesus macaque brain: isoflurane or ischemia-reperfusion? Anesthesiology. 2010;113:1245. author reply -6. - PubMed
    1. Slikker W, Jr., Zou X, Hotchkiss CE, Divine RL, Sadovova N, Twaddle NC, Doerge DR, Scallet AC, Patterson TA, Hanig JP, Paule MG, Wang C. Ketamine-induced neuronal cell death in the perinatal rhesus monkey. Toxicological sciences : an official journal of the Society of Toxicology. 2007;98:145–58. - PubMed
    1. Haley-Andrews S. Ketamine: the sedative of choice in a busy pediatric emergency department. J Emerg Nurs. 2006;32:186–8. - PubMed

Publication types

MeSH terms